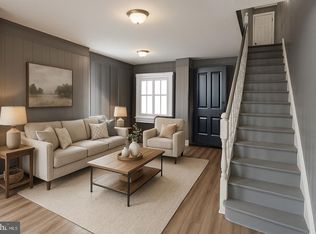
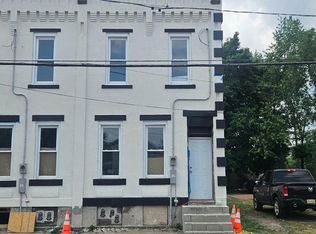
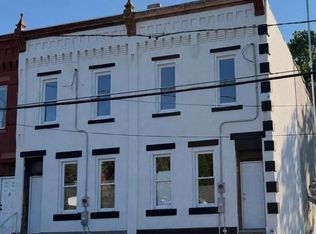
$172,200
-- bd-- ba1.9k sqft
251 Tyler St, Trenton, NJ 08609
Off Market
Zillow last checked:
Listing updated:
Alex Isakov 609-488-6300,
Realty Mark Central, LLC

Not available
Estimated sales range
Not available
Not available
| Date | Event | Price |
|---|---|---|
| 10/22/2026 | Listed for sale | $249,888+614%$171/sqft |
Source:  Bright MLS #NJME2085350 Report a problem | ||
| 3/24/2021 | Listing removed | -- |
Source: Owner Report a problem | ||
| 12/6/2019 | Sold | $35,000-33.8%$24/sqft |
Source: Public Record Report a problem | ||
| 7/25/2019 | Listing removed | $1,200$1/sqft |
Source: Owner Report a problem | ||
| 7/14/2019 | Price change | $1,200+9.1%$1/sqft |
Source: Owner Report a problem | ||
| 6/29/2019 | Listed for rent | $1,100$1/sqft |
Source: Owner Report a problem | ||
| 9/9/2016 | Listing removed | $52,900$36/sqft |
Source: Berkshire Hathaway HomeServices Fox & Roach, REALTORS #6640444 Report a problem | ||
| 9/2/2016 | Listed for sale | $52,900-8.6%$36/sqft |
Source: Berkshire Hathaway HomeServices Fox & Roach, REALTORS #6640444 Report a problem | ||
| 9/10/2015 | Listed for sale | $57,900+15.8%$40/sqft |
Source: BHHS Fox & Roach #6640444 Report a problem | ||
| 11/27/2014 | Listing removed | $50,000$34/sqft |
Source: Berkshire Hathaway HomeServices Fox & Roach, Realtors #6312043 Report a problem | ||
| 11/27/2013 | Listed for sale | $50,000+150%$34/sqft |
Source: BHHS Fox & Roach-Newtown #6312043 Report a problem | ||
| 9/8/2000 | Sold | $20,000$14/sqft |
Source: Public Record Report a problem | ||
| Year | Property taxes | Tax assessment |
|---|---|---|
| 2026 | $3,646 +1.5% | $61,900 |
| 2025 | $3,591 | $61,900 |
| 2024 | $3,591 +4.5% | $61,900 |
| 2023 | $3,437 | $61,900 |
| 2022 | $3,437 +0.3% | $61,900 |
| 2021 | $3,426 +1.6% | $61,900 |
| 2020 | $3,371 +4.5% | $61,900 |
| 2019 | $3,227 +5.2% | $61,900 |
| 2018 | $3,067 +7.3% | $61,900 |
| 2017 | $2,859 +0.3% | $61,900 +24.5% |
| 2016 | $2,849 +0.5% | $49,700 |
| 2015 | $2,836 +0.6% | $49,700 |
| 2014 | $2,818 -9.1% | $49,700 -9.6% |
| 2012 | $3,100 +2.9% | $55,000 |
| 2011 | $3,013 +16.8% | $55,000 |
| 2010 | $2,580 +7% | $55,000 |
| 2009 | $2,411 +4.6% | $55,000 |
| 2008 | $2,305 +2.2% | $55,000 |
| 2007 | $2,255 | $55,000 |
| 2006 | -- | $55,000 |
| 2005 | -- | $55,000 |
Source: Bright MLS. This data may not be complete. We recommend contacting the local school district to confirm school assignments for this home.


A local agent can set up tours, give advice and negotiate with sellers.