Three unit Multi family, separate utilities first and second floor occupied with tenants at will; third floor is vacant and ready for move in or rental! unit layout is all very similar. Close highway access, basement offers laundry hookups for all 3 units.
For sale
$680,000
25 Adams St, New Bedford, MA 02746
9beds
3,321sqft
3 Family
Built in 1910
-- sqft lot
$666,300 Zestimate®
$205/sqft
$-- HOA
What's special
- 3 days
- 123
- 5
Zillow last checked:
Listing updated:
Listed by:
Todd Mello 508-567-0000,
Lion Gate Real Estate, Inc. 508-673-0001,
Andrea Mello 774-991-2309
Source: MLS PIN,MLS#: 73591857
Facts & features
Interior
Bedrooms & bathrooms
- Bedrooms: 9
- Bathrooms: 3
- Full bathrooms: 3
Features
- Basement: Full,Interior Entry
- Has fireplace: No
Interior area
- Total structure area: 3,321
- Total interior livable area: 3,321 sqft
- Finished area above ground: 3,321
Property
Features
- Fencing: Fenced/Enclosed
Lot
- Size: 4,147 Square Feet
Details
- Parcel number: M:0091 L:0047,2898074
- Zoning: RC
Construction
Type & style
- Home type: MultiFamily
- Property subtype: 3 Family
Materials
- Foundation: Granite
Condition
- Year built: 1910
Utilities & green energy
- Electric: 220 Volts
- Sewer: Public Sewer
- Water: Public
Community & HOA
Community
- Features: Public Transportation, Shopping, Laundromat, Highway Access, House of Worship, Marina, Private School, Public School
Location
- Region: New Bedford
Financial & listing details
- Price per square foot: $205/sqft
- Tax assessed value: $399,200
- Annual tax amount: $4,515
- Date on market: 10/16/2026
- Total actual rent: 3500
Estimated market value
$666,300
$633,000 - $700,000
$1,834/mo
Price history
| Date | Event | Price |
|---|---|---|
| 10/16/2026 | Listed for sale | $680,000+325%$205/sqft |
Source: MLS PIN #73591857 Report a problem | ||
| 7/1/2014 | Sold | $160,000+15.5%$48/sqft |
Source: Public Record Report a problem | ||
| 11/17/1988 | Sold | $138,500+889.3%$42/sqft |
Source: Public Record Report a problem | ||
| 2/19/1988 | Sold | $14,000-82.7%$4/sqft |
Source: Public Record Report a problem | ||
| 6/23/1987 | Sold | $81,000$24/sqft |
Source: Public Record Report a problem | ||
Public tax history
| Year | Property taxes | Tax assessment |
|---|---|---|
| 2025 | $4,515 +6.4% | $399,200 +12.9% |
| 2024 | $4,243 -0.9% | $353,600 +18.1% |
| 2023 | $4,280 +10.9% | $299,500 +20.6% |
| 2022 | $3,859 +2.5% | $248,300 +2.8% |
| 2021 | $3,765 +0.6% | $241,500 +4.3% |
| 2020 | $3,743 +16.4% | $231,600 +18.6% |
| 2019 | $3,217 +5.3% | $195,300 +6.3% |
| 2018 | $3,055 +8.3% | $183,700 +8.7% |
| 2017 | $2,821 +4.4% | $169,000 +3.1% |
| 2016 | $2,703 +7.3% | $163,900 +2.4% |
| 2015 | $2,518 +3.8% | $160,100 +0.1% |
| 2014 | $2,426 -3.3% | $160,000 -8.6% |
| 2013 | $2,509 -1.4% | $175,100 -5.3% |
| 2012 | $2,544 -8% | $184,900 -13.9% |
| 2011 | $2,765 -7.7% | $214,700 -13.8% |
| 2010 | $2,997 +1.6% | $249,100 -3.3% |
| 2009 | $2,951 +5.3% | $257,700 -3% |
| 2008 | $2,803 +2.3% | $265,700 |
| 2007 | $2,739 +10.2% | $265,700 +16.2% |
| 2006 | $2,485 +34.8% | $228,600 +40.9% |
| 2005 | $1,844 +15.5% | $162,200 +25.6% |
| 2004 | $1,597 +7.5% | $129,100 +27.4% |
| 2003 | $1,485 -1.8% | $101,300 +3.3% |
| 2002 | $1,512 +2.2% | $98,100 +7.7% |
| 2000 | $1,479 +4.4% | $91,100 -14.6% |
| 1996 | $1,416 | $106,700 |
Find assessor info on the county website
Monthly payment
Est. payment
Payment breakdown
Explore the cost of this home by adjusting the details. Changes won't be saved.Climate risks
Neighborhood: 02746


Similar homes
- $689,0009 bd3 ba3.4k sqft543 Coggeshall St, New Bedford, MA 02746For Sale
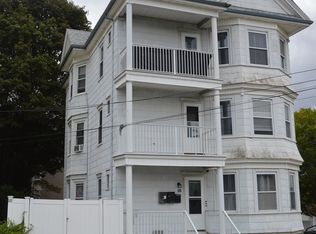 MLS ID #73581098, Francis Gropman, Conway - Wareham. MLS PIN
- $689,9007 bd4 ba2.5k sqft507-509 Nash Rd, New Bedford, MA 02746For Sale
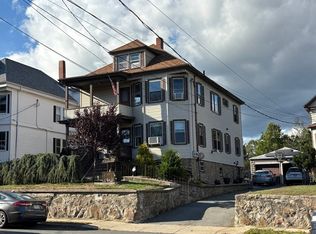 MLS ID #73591496, Shawn Sousa, Home Advantage Real Estate, Inc.. MLS PIN
- $750,00010 bd6 ba4.2k sqft56 Nye St, New Bedford, MA 02746For Sale
 MLS ID #73592004, Leovanni Baessa, Compass. MLS PIN
- $679,9009 bd3 ba4.1k sqft47 Holly St, New Bedford, MA 02746For Sale
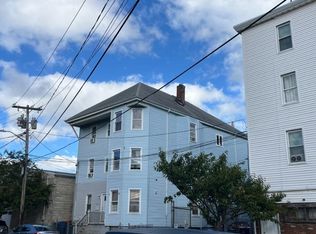 MLS ID #73581404, Carlos Mota, Silva Realty Group, Inc.. MLS PIN
