Discover an exceptional opportunity to acquire a high-performing, two-story, 12-room rooming house situated on a corner lot with a spacious backyard. Generating over $10,000 per month in rental income, this turnkey asset offers strong existing cash flow, an established management structure, and long-term upside, making it an ideal addition to any real estate portfolio. The property features a practical layout distributed across two floors, comprising 12 rooms, 2 full bathrooms, and 2 half bathrooms, while the expansive backyard provides valuable outdoor space for residents. Positioned on a prominent corner lot, there is added flexibility to explore adding a driveway or dedicated off-street parking, subject to local zoning regulations and municipal approvals. Investors will appreciate the established operation with a hands-on property manager overseeing day-to-day operations for a streamlined, hands-off ownership experience. Whether you are an experienced investor looking to scale your portfolio or seeking a reliable income-producing property with immediate return, this listing delivers a rare blend of stability and potential. Strong cash flow, established management, and outstanding potential make this a versatile investment not to miss; buyer and buyer’s agent to perform all due diligence regarding property details, square footage, room count, rental income, zoning, parking feasibility, and municipal approvals.
For sale
$699,000
39 Sycamore St, New Bedford, MA 02740
12beds
2,329sqft
5+ Family - Rooming House
Built in 1876
-- sqft lot
$697,500 Zestimate®
$300/sqft
$-- HOA
What's special
Spacious backyardCorner lot
- 6 days
- 95
- 6
Zillow last checked:
Listing updated:
Listed by:
Philip Rebello 508-974-5402,
Keller Williams South Watuppa 508-677-3233
Source: MLS PIN,MLS#: 73592513
Facts & features
Interior
Bedrooms & bathrooms
- Bedrooms: 12
- Bathrooms: 4
- Full bathrooms: 2
- 1/2 bathrooms: 2
Appliances
- Laundry: Gas Dryer Hookup, Washer Hookup
Features
- Flooring: Wood
- Basement: Partially Finished,Interior Entry
- Has fireplace: No
Interior area
- Total structure area: 2,329
- Total interior livable area: 2,329 sqft
- Finished area above ground: 2,329
Property
Parking
- Parking features: Off Street
Features
- Patio & porch: Porch
- Waterfront features: Bay, Ocean, 1 to 2 Mile To Beach, Beach Ownership(Public)
Lot
- Size: 3,768 Square Feet
- Features: Other
Details
- Parcel number: M:0065 L:0209,2894142
- Zoning: RB
Construction
Type & style
- Home type: MultiFamily
- Property subtype: 5+ Family - Rooming House
Materials
- Frame
- Foundation: Granite, Irregular
- Roof: Shingle
Condition
- Year built: 1876
Utilities & green energy
- Electric: Circuit Breakers, 200+ Amp Service
- Sewer: Public Sewer
- Water: Public
- Utilities for property: for Gas Dryer, Washer Hookup
Community & HOA
Location
- Region: New Bedford
Financial & listing details
- Price per square foot: $300/sqft
- Tax assessed value: $540,200
- Annual tax amount: $6,110
- Date on market: 10/16/2026
- Total actual rent: 0
Estimated market value
$697,500
$663,000 - $732,000
$3,583/mo
Price history
| Date | Event | Price |
|---|---|---|
| 10/19/2026 | Listed for sale | $699,000+12.7%$300/sqft |
Source: MLS PIN #73592513 Report a problem | ||
| 12/8/2025 | Sold | $620,000-3.1%$266/sqft |
Source: MLS PIN #73329054 Report a problem | ||
| 9/23/2025 | Contingent | $639,900$275/sqft |
Source: MLS PIN #73329054 Report a problem | ||
| 9/2/2025 | Price change | $639,900-1.5%$275/sqft |
Source: MLS PIN #73329054 Report a problem | ||
| 6/2/2025 | Price change | $649,900-2.3%$279/sqft |
Source: MLS PIN #73329054 Report a problem | ||
| 3/13/2025 | Price change | $664,900-1.5%$285/sqft |
Source: MLS PIN #73329054 Report a problem | ||
| 1/24/2025 | Listed for sale | $674,900+22.7%$290/sqft |
Source: MLS PIN #73329054 Report a problem | ||
| 5/24/2023 | Sold | $550,000-8.3%$236/sqft |
Source: MLS PIN #73078349 Report a problem | ||
| 2/11/2023 | Listed for sale | $600,000+122.2%$258/sqft |
Source: MLS PIN #73078349 Report a problem | ||
| 2/24/2006 | Sold | $270,000+350%$116/sqft |
Source: Public Record Report a problem | ||
| 9/29/2000 | Sold | $60,000+14.3%$26/sqft |
Source: Public Record Report a problem | ||
| 6/22/2000 | Sold | $52,500-25%$23/sqft |
Source: Public Record Report a problem | ||
| 12/28/1990 | Sold | $70,000$30/sqft |
Source: Public Record Report a problem | ||
Public tax history
| Year | Property taxes | Tax assessment |
|---|---|---|
| 2025 | $6,110 +16.5% | $540,200 +23.6% |
| 2024 | $5,243 +79.2% | $436,900 +113.4% |
| 2023 | $2,925 -3.6% | $204,700 +4.9% |
| 2022 | $3,033 -0.3% | $195,200 |
| 2021 | $3,043 +6.4% | $195,200 +10.3% |
| 2020 | $2,860 +7.1% | $177,000 +9.1% |
| 2019 | $2,671 +5.9% | $162,200 +6.9% |
| 2018 | $2,523 -0.4% | $151,700 |
| 2017 | $2,532 -11.6% | $151,700 -12.6% |
| 2016 | $2,863 +4.3% | $173,600 -0.5% |
| 2015 | $2,745 +3.3% | $174,500 -0.5% |
| 2014 | $2,658 -1.1% | $175,300 -6.5% |
| 2013 | $2,687 +2% | $187,500 -2% |
| 2012 | $2,634 -5.5% | $191,400 -11.5% |
| 2011 | $2,786 -1.3% | $216,300 -7.8% |
| 2010 | $2,823 +0.2% | $234,700 -4.6% |
| 2009 | $2,817 +9.4% | $246,000 +0.8% |
| 2008 | $2,575 +25.3% | $244,100 +22.5% |
| 2007 | $2,055 +21% | $199,300 +27.6% |
| 2006 | $1,698 -3.3% | $156,200 +1.2% |
| 2005 | $1,756 -6.6% | $154,400 +1.6% |
| 2004 | $1,880 +37.1% | $152,000 +62.6% |
| 2003 | $1,371 +14.9% | $93,500 +20.8% |
| 2002 | $1,193 -4.8% | $77,400 +0.3% |
| 2000 | $1,253 +11.6% | $77,200 -8.7% |
| 1996 | $1,123 | $84,600 |
Find assessor info on the county website
Monthly payment
Est. payment
Payment breakdown
Explore the cost of this home by adjusting the details. Changes won't be saved.Climate risks
Neighborhood: 02740


Similar homes
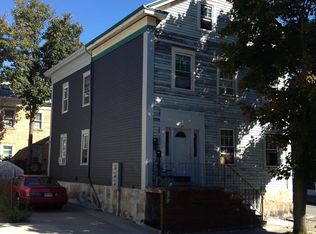
- $690,0009 bd3 ba3.3k sqft211 Weld St, New Bedford, MA 02740For Sale
 MLS ID #73576716, Luis Rodrigues, Realty One Group Dream Makers. MLS PIN
- $--9 bd3 ba3.1k sqft158 Thompson St, New Bedford, MA 02740Auction
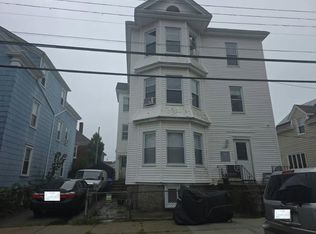 Auction.com 2
- $599,9009 bd3 ba3.1k sqft1190 Pleasant St, New Bedford, MA 02740For Sale
 MLS ID #73574659, Abigail MacLeod, RE/MAX Legacy. MLS PIN
- $569,90010 bd3 ba2.4k sqft192 Walnut St, New Bedford, MA 02740For Sale
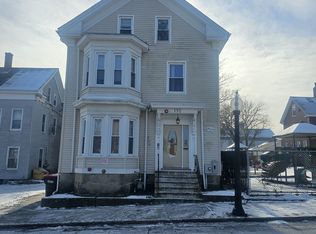 MLS ID #73329052, Team ROSO, RE/MAX Vantage. MLS PIN
