This 2017 square foot single family home has 4 bedrooms and 2.5 bathrooms. This home is located at 253 NW 166th Ave, Pembroke Pines, FL 33028.
Pre-foreclosure
Est. $661,600
253 NW 166th Ave, Pembroke Pines, FL 33028
4beds
2baths
2,017sqft
SingleFamily
Built in 1994
5,791 Square Feet Lot
$661,600 Zestimate®
$328/sqft
$329/mo HOA
What's special
Safe communityPrivate patioBig garageClose to hollywood beachBig windowsLarge housePembroke pines
- 134 days
- 9
- 0
Facts & features
Interior
Bedrooms & bathrooms
- Bedrooms: 4
- Bathrooms: 2.5
Heating
- Forced air
Cooling
- Other
Appliances
- Included: Dishwasher, Dryer, Garbage disposal, Microwave, Washer
- Laundry: In Unit
Features
- Flooring: Tile, Concrete
Interior area
- Total interior livable area: 2,017 sqft
Property
Parking
- Parking features: Garage - Detached
Features
- Exterior features: Stucco, Cement / Concrete
Lot
- Size: 5,791 Square Feet
Details
- Parcel number: 514008081270
Construction
Type & style
- Home type: SingleFamily
Materials
- masonry
- Foundation: Other
- Roof: Tile
Condition
- Year built: 1994
Community & HOA
HOA
- Has HOA: Yes
- HOA fee: $329 monthly
Location
- Region: Pembroke Pines
Financial & listing details
- Price per square foot: $328/sqft
- Tax assessed value: $628,370
- Annual tax amount: $7,790
Foreclosure details
Estimated market value
$661,600
$615,000 - $701,000
$4,024/mo
Price history
| Date | Event | Price |
|---|---|---|
| 3/15/2022 | Listing removed | -- |
Source: Zillow Rental Network_1 Report a problem | ||
| 3/9/2022 | Listed for rent | $4,850$2/sqft |
Source: Zillow Rental Network_1 Report a problem | ||
| 1/16/2022 | Listing removed | -- |
Source:  MIAMI #A11112139 Report a problem | ||
| 11/14/2021 | Price change | $549,500-0.1%$272/sqft |
Source: MIAMI #A11112139 Report a problem | ||
| 10/15/2021 | Listed for sale | $549,900+0.2%$273/sqft |
Source: MIAMI #A11112139 Report a problem | ||
| 9/15/2021 | Listing removed | -- |
Source: MIAMI #A11009854 Report a problem | ||
| 8/6/2021 | Price change | $549,000+3.8%$272/sqft |
Source: MIAMI #A11009854 Report a problem | ||
| 8/2/2021 | Listed for sale | $529,000$262/sqft |
Source: MIAMI #A11009854 Report a problem | ||
| 6/29/2021 | Listing removed | -- |
Source: MIAMI #A11009854 Report a problem | ||
| 3/8/2021 | Listed for sale | $529,000$262/sqft |
Source: MIAMI #A11009854 Report a problem | ||
| 3/8/2021 | Listing removed | -- |
Source: MIAMI #A10996120 Report a problem | ||
| 2/8/2021 | Listed for sale | $529,000+232.7%$262/sqft |
Source: MIAMI #A10996120 Report a problem | ||
| 12/2/2019 | Sold | $159,000-11.4%$79/sqft |
Source: Public Record Report a problem | ||
| 6/14/2001 | Sold | $179,500+37.7%$89/sqft |
Source: Public Record Report a problem | ||
| 6/1/1994 | Sold | $130,400$65/sqft |
Source: Public Record Report a problem | ||
Public tax history
| Year | Property taxes | Tax assessment |
|---|---|---|
| 2025 | $7,790 +2.8% | $435,360 +2.9% |
| 2024 | $7,576 +2.8% | $423,100 +3% |
| 2023 | $7,369 +4.6% | $410,780 +3% |
| 2022 | $7,045 +1.6% | $398,820 +3% |
| 2021 | $6,936 +1% | $387,210 +1.4% |
| 2020 | $6,866 +87.4% | $381,870 +78.9% |
| 2019 | $3,665 | $213,400 +1.9% |
| 2018 | $3,665 +4% | $209,430 +2.1% |
| 2017 | $3,523 +1.3% | $205,130 +2.1% |
| 2016 | $3,477 +0.6% | $200,920 +0.7% |
| 2015 | $3,457 -1.4% | $199,530 +0.8% |
| 2014 | $3,506 +0.2% | $197,950 -9.7% |
| 2013 | $3,499 +2.5% | $219,220 +2.1% |
| 2012 | $3,412 +3.1% | $214,710 +6% |
| 2011 | $3,309 -1.6% | $202,480 +10.4% |
| 2010 | $3,363 +7.9% | $183,440 +2.7% |
| 2009 | $3,117 +4.4% | $178,620 +0.1% |
| 2008 | $2,985 -4.1% | $178,450 +3% |
| 2007 | $3,113 | $173,260 |
Find assessor info on the county website
Monthly payment
Climate risks
Neighborhood: Spring Valley
- $694,1004 bd3 ba2.1k sqft200 NW 165th Ave, Pembroke Pines, FL 33028Off Market

- $644,3004 bd2 ba2.1k sqft16534 NW 3rd St, Pembroke Pines, FL 33028Off Market
- $671,1004 bd3 ba2k sqft16554 NW 3rd St, Pembroke Pines, FL 33028Off Market

- $620,0003 bd2 ba1.6k sqft16514 NW 3rd St, Pembroke Pines, FL 33028Off Market

Similar homes
- $639,9003 bd2 ba1.7k sqft16561 NW 9TH Street, Pembroke Pines, FL 33028For Sale
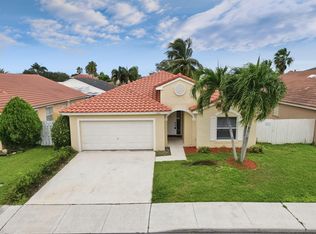
 MLS ID #B26097131, Michael McGee, Mainstay Brokerage LLC. BeachesMLS
- $699,0003 bd2 ba1.6k sqftSpring Valley, Pembroke Pines, FL 33028For Sale
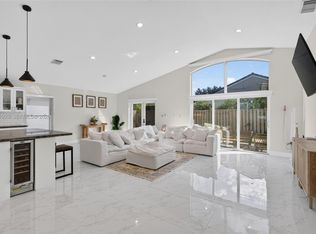
 MLS ID #A12111005, Michele Noonan, Keller Williams Dedicated Professionals. MIAMI
- $630,0003 bd2 ba1.6k sqft870 NW 166TH Avenue, Pembroke Pines, FL 33028For Sale
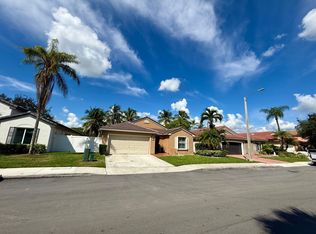 MLS ID #B26085928, Diana Hejeile, Century 21 Global Connections. BeachesMLS
- $675,0003 bd3 ba2k sqftPembroke Pines Regional, Pembroke Pines, FL 33028For Sale
 MLS ID #A12094186, Patty Da Silva, Green Realty Properties Inc.. MIAMI
- $789,0004 bd2 ba2.3k sqftWestfork 1 Plat, Pembroke Pines, FL 33028For SaleMLS ID #A12047650, Nerva Brandon, United Realty Group Inc.. MIAMI
- $759,0004 bd3 ba2k sqft17021 NW 10TH Street, Pembroke Pines, FL 33028For SaleMLS ID #B26052524, Daniel D Karras, Home Sweet Home Real Estate. BeachesMLS
- $680,0004 bd3 ba2.6k sqftParkside At Spring Valley, Pembroke Pines, FL 33028For SaleMLS ID #A11992880, Gary Yu, Golden Realty Inc. MIAMI
- $749,0003 bd3 ba2.2k sqft16413 NW 12th Street, Pembroke Pines, FL 33028For SaleMLS ID #B26051245, Alexandra M Binkley, Aqua Realty Services. BeachesMLS
- $579,0003 bd2 ba1.5k sqftTowngate, Pembroke Pines, FL 33028For SaleMLS ID #A12114379, Claudia Willard, Willard Realty Team Corp. MIAMI
- $719,0004 bd3 ba2.2k sqftTowngate, Pembroke Pines, FL 33028For SaleMLS ID #A12051034, Sandra Guerra, My Realty Group, LLC.. MIAMI
- $635,9993 bd2 ba1.8k sqft363 SW 161st Avenue, Pembroke Pines, FL 33027For SaleMLS ID #B26092214, Kerinsa Lemons, Relentless Real Estate Co.. BeachesMLS
- $670,0003 bd2 ba1.8k sqftSilver Shores (Parcels H, Hollywood, FL 33027For SaleMLS ID #A12114385, Roberto Lizarralde, Compass Florida, LLC. MIAMI
- $720,0003 bd3 ba1.8k sqft1384 NW 144th Avenue, Pembroke Pines, FL 33028For SaleMLS ID #B26090678, Amy McGrotty, EXP Realty LLC. BeachesMLS
- $675,0004 bd3 ba2k sqftHollywood Lakes Country C, Pembroke Pines, FL 33027For SaleMLS ID #A12103974, Claudia Willard, Willard Realty Team Corp. MIAMI
- $720,0004 bd3 ba1.9k sqftSilver Lakes At Pembroke, Pembroke Pines, FL 33029For SaleMLS ID #A12105443, Maritza Torroba, LoKation. MIAMI
- $720,0003 bd3 ba1.6k sqftTowngate, Pembroke Pines, FL 33028For SaleMLS ID #A12097070, Alejandra Nogales, Real Estate Empire Group, Inc.. MIAMI
- $619,7004 bd2 ba1.4k sqftSilver Lakes Phase Iii, Miramar, FL 33029For SaleMLS ID #A12118531, Elizabeth Coto, One Sotheby's International Realty. MIAMI
- $639,9004 bd2 ba1.5k sqftSilver Lakes At Pembroke, Pembroke Pines, FL 33029For SaleMLS ID #A12077062, Zoramir Rodriguez, Realty One Group Evolution. MIAMI
- $750,0004 bd3 ba2k sqftSilver Lakes At Pembroke, Pembroke Pines, FL 33029For SaleMLS ID #A12101849, Mariana Vieira De Barros, Chez Realty, LLC.. MIAMI
