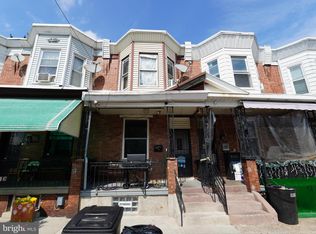
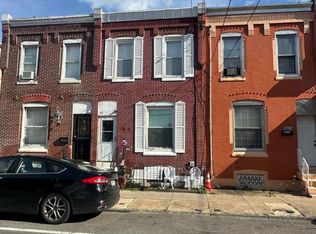
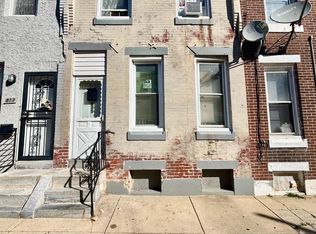
$61,900
3 bd1 ba900 sqft
255 E Elkhart St, Philadelphia, PA 19134
Off Market

Likely to sell faster than
Zillow last checked:
Listing updated:
Phill Noeun 267-269-6178,
Canaan Realty Services INC 2153331826,
Co-Listing Agent: Huey Tsang 267-269-6869,
Canaan Realty Services INC

Not available
Estimated sales range
Not available
Not available
| Date | Event | Price |
|---|---|---|
| 2/2/2025 | Listing removed | $85,000$92/sqft |
Source:  Bright MLS #PAPH2428314 Report a problem | ||
| 12/22/2024 | Price change | $85,000-5.5%$92/sqft |
Source: Bright MLS #PAPH2428314 Report a problem | ||
| 12/16/2024 | Listed for sale | $89,990$97/sqft |
Source: Bright MLS #PAPH2428314 Report a problem | ||
| 12/6/2024 | Listing removed | $89,990$97/sqft |
Source: Bright MLS #PAPH2376254 Report a problem | ||
| 11/4/2024 | Price change | $89,9900%$97/sqft |
Source: Bright MLS #PAPH2376254 Report a problem | ||
| 10/21/2024 | Listed for sale | $90,000$97/sqft |
Source: Bright MLS #PAPH2376254 Report a problem | ||
| 10/8/2024 | Listing removed | $90,000-5.3%$97/sqft |
Source: Bright MLS #PAPH2376254 Report a problem | ||
| 7/15/2024 | Listed for sale | $95,000-13.6%$103/sqft |
Source: Bright MLS #PAPH2376254 Report a problem | ||
| 5/22/2024 | Listing removed | -- |
Source: Bright MLS #PAPH2316422 Report a problem | ||
| 1/27/2024 | Listed for sale | $110,000+46.7%$119/sqft |
Source: Bright MLS #PAPH2316422 Report a problem | ||
| 6/7/2023 | Listing removed | $75,000$81/sqft |
Source: Bright MLS #PAPH2196990 Report a problem | ||
| 1/24/2023 | Listed for sale | $75,000+25%$81/sqft |
Source: Bright MLS #PAPH2196990 Report a problem | ||
| 5/1/2019 | Listing removed | $60,000$65/sqft |
Source: Prosperity Real Estate & Inves #PAPH506274 Report a problem | ||
| 12/24/2018 | Listed for sale | $60,000+380%$65/sqft |
Source: Prosperity Real Estate & Inves #PAPH506274 Report a problem | ||
| 7/11/2017 | Sold | $12,500+3.2%$14/sqft |
Source: Public Record Report a problem | ||
| 7/31/2006 | Sold | $12,110-79.8%$13/sqft |
Source: Public Record Report a problem | ||
| 7/31/2004 | Sold | $60,000+252.9%$65/sqft |
Source: Public Record Report a problem | ||
| 4/12/2002 | Sold | $17,000+3%$18/sqft |
Source: Public Record Report a problem | ||
| 3/15/1999 | Sold | $16,500$18/sqft |
Source: Public Record Report a problem | ||
| Year | Property taxes | Tax assessment |
|---|---|---|
| 2025 | $866 +16.4% | $61,900 +16.4% |
| 2024 | $745 | $53,200 |
| 2023 | $745 +116.3% | $53,200 |
| 2022 | $344 | -- |
| 2021 | $344 +161.7% | -- |
| 2018 | $132 | -- |
| 2017 | $132 -78.4% | -- |
| 2016 | $610 | -- |
| 2015 | $610 | -- |
| 2014 | $610 | $46,600 +1155.4% |
| 2012 | -- | $3,712 |
| 2011 | -- | $3,712 |
| 2010 | -- | $3,712 |
| 2009 | -- | $3,712 |
| 2008 | -- | $3,712 |
| 2007 | -- | $3,712 +7.4% |
| 2006 | -- | $3,456 |
| 2005 | -- | $3,456 |
| 2004 | -- | $3,456 +10.2% |
| 2003 | -- | $3,136 -39.5% |
| 2002 | -- | $5,184 |
| 2000 | -- | $5,184 +40.9% |
| 1999 | -- | $3,680 |
Source: Bright MLS. This data may not be complete. We recommend contacting the local school district to confirm school assignments for this home.
A local agent can set up tours, give advice and negotiate with sellers.
A local lender can help you make sure your offer is ready when you are.