2 single family homes on 1 lot, If you buy with a friend or family member, you each OWN your OWN home for less than $440,000 each. 2 Homes for the price of 1. NO HOA dues, NO hallways or lobby. The homes were built in 1964, this is not an ADU. It was built as separate homes. There are wood floors, laundry hook ups, a/c wall units, lots of sliding doors and windows. Add your OWN designer finishes. NEW exterior paint. This is close to Riverside Dr. and the 2 and the 5 freeways, it is 15 mins from the Sunset Blvd., and Alvarado intersection and close to "Dodger's Stadium". REDUCED in Aug. $110,000. There are outdoor spaces, for each home.
For sale
Price cut: $110K (8/14)
$875,000
2660 Newell St, Los Angeles, CA 90039
5beds
3baths
2,064sqft
Multi Family
Built in 1964
-- sqft lot
$878,500 Zestimate®
$424/sqft
$-- HOA
What's special
- 138 days
- 570
- 65
Zillow last checked:
Listing updated:
Listed by:
Ron Thomas DRE # 01032593 310-650-7115,
Keller Williams Hollywood Hills 310-623-1300
Source: CLAW,MLS#: 26843901
Facts & features
Interior
Bedrooms & bathrooms
- Bedrooms: 5
- Bathrooms: 3
Heating
- Wall
Cooling
- Wall/Window Unit(s)
Appliances
- Laundry: Inside
Features
- Has fireplace: Yes
- Fireplace features: Kitchen, Living Room, Patio
Interior area
- Total structure area: 2,064
- Total interior livable area: 2,064 sqft
Property
Parking
- Total spaces: 3
- Parking features: Driveway
- Uncovered spaces: 3
Features
- Levels: One
- Stories: 1
Lot
- Size: 5,453 Square Feet
Details
- Additional structures: Shed(s)
- Parcel number: 5442015016
- Zoning: LAR2
- Special conditions: Probate Listing
- Other equipment: Other
Construction
Type & style
- Home type: MultiFamily
- Property subtype: Multi Family
Condition
- Year built: 1964
Community & HOA
Location
- Region: Los Angeles
Financial & listing details
- Price per square foot: $424/sqft
- Tax assessed value: $69,798
- Date on market: 6/24/2026
Estimated market value
$878,500
$835,000 - $922,000
$3,171/mo
Price history
| Date | Event | Price |
|---|---|---|
| 8/14/2026 | Price change | $875,000-11.2%$424/sqft |
Source:  CLAW #26843901 Report a problem | ||
| 6/24/2026 | Listed for sale | $985,000-1%$477/sqft |
Source: CLAW #26843901 Report a problem | ||
| 5/17/2026 | Listing removed | $995,000$482/sqft |
Source: CLAW #26657049 Report a problem | ||
| 2/22/2026 | Listed for sale | $995,000$482/sqft |
Source: CLAW #25602195 Report a problem | ||
| 2/4/2026 | Listing removed | $995,000$482/sqft |
Source: CLAW #25602195 Report a problem | ||
| 10/6/2025 | Listed for sale | $995,000-5.2%$482/sqft |
Source: CLAW #25602195 Report a problem | ||
| 9/26/2025 | Listing removed | $1,050,000-8.7%$509/sqft |
Source:  SDMLS #DW25136511 Report a problem | ||
| 6/23/2025 | Listed for sale | $1,150,000$557/sqft |
Source: SDMLS #DW25136511 Report a problem | ||
Public tax history
| Year | Property taxes | Tax assessment |
|---|---|---|
| 2026 | -- | $71,193 +2% |
| 2025 | $1,209 +12% | $69,798 +2% |
| 2024 | $1,079 +1.5% | $68,430 +2% |
| 2023 | $1,063 +4.1% | $67,089 +2% |
| 2022 | $1,020 +2.5% | $65,774 +2% |
| 2021 | $995 -0.3% | $64,486 +1% |
| 2020 | $998 | $63,826 +2% |
| 2019 | $998 +11.6% | $62,576 +2% |
| 2018 | $894 | $61,350 +2% |
| 2017 | $894 +2.2% | $60,148 +2% |
| 2016 | $875 +5.5% | $58,969 +1.5% |
| 2015 | $829 -0.6% | $58,084 +2% |
| 2014 | $834 | $56,947 +2.5% |
| 2012 | -- | $55,580 +2% |
| 2011 | -- | $54,491 +0.5% |
| 2009 | -- | $54,215 +2% |
| 2008 | -- | $53,153 +4% |
| 2005 | -- | $51,091 +4% |
| 2004 | -- | $49,110 +1.9% |
| 2003 | -- | $48,211 +2% |
| 2002 | -- | $47,266 +4% |
| 2000 | -- | $45,433 |
Find assessor info on the county website
Monthly payment
Est. payment
Payment breakdown
Explore the cost of this home by adjusting the details. Changes won't be saved.Climate risks
Neighborhood: Elysian Valley
Similar homes
- $859,0006 bd3 ba2.4k sqft119 E Avenue 36, Los Angeles, CA 90031For Sale
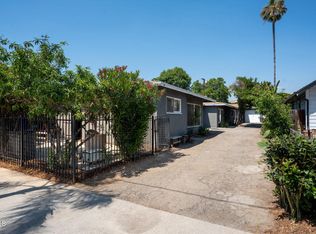 MLS ID #P1-27115, Allan Vides, Avida & Associates. CRMLS
- $1,195,0004 bd2 ba2k sqft2106 India St, Los Angeles, CA 90039For Sale
 MLS ID #26867289, Yuichi Bryan Miyamoto DRE # 01346587, Keller Williams Realty Los Feliz. CLAW
- $849,0004 bd3 ba2k sqft3566 Chesapeake Ave, Los Angeles, CA 90016For Sale
 MLS ID #26106148, Pila Jessie DRE # 01324968, KHORR Realty. CLAW
- $1,037,0006 bd2 ba1.9k sqft536 W 42nd St, Los Angeles, CA 90037For Sale
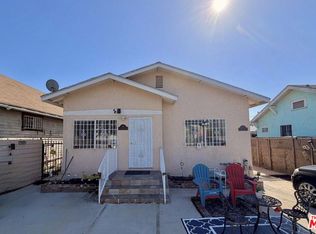 MLS ID #26844849, Jeffrey Sklar DRE # 02075404, Beycome Brokerage Realty Inc.. CLAW
