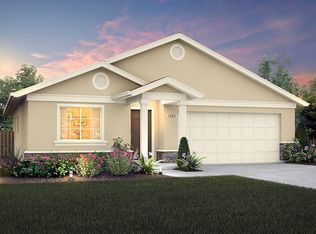
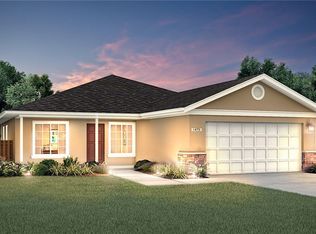
Wonderful home with open floor plan, Vaulted ceilings in master bedroom, Large living room. Spacious front yard and low maintenance backyard as it has concrete. Conveniently located to easy freeway access.
Active
$439,950
272 E San Pedro St, Merced, CA 95341
4beds
1,842sqft
Single Family Residence
Built in 2020
5,113 Square Feet Lot
$438,000 Zestimate®
$239/sqft
$-- HOA
What's special
Spacious front yardLow maintenance backyardOpen floor plan
- 16 days
- 157
- 2
Likely to sell faster than
Zillow last checked:
Listing updated:
Listed by:
Armando Magana DRE #01376533 209-614-6232,
Castle Real Estate
Source: MetroList Services of CA,MLS#: 226122638Originating MLS: MetroList Services, Inc.
Facts & features
Interior
Bedrooms & bathrooms
- Bedrooms: 4
- Bathrooms: 2
- Full bathrooms: 2
Dining room
- Features: Space in Kitchen
Kitchen
- Features: Kitchen/Family Combo
Heating
- Central
Cooling
- Central Air
Appliances
- Included: Free-Standing Gas Range, Tankless Water Heater
- Laundry: Inside
Features
- Flooring: Carpet, Linoleum
- Has fireplace: No
Interior area
- Total interior livable area: 1,842 sqft
Property
Parking
- Total spaces: 2
- Parking features: Garage Faces Front
- Garage spaces: 2
Lot
- Size: 5,113 Square Feet
- Features: Irregular Lot
Details
- Parcel number: 259297003000
- Zoning: R-1
- Special conditions: Standard
Construction
Type & style
- Home type: SingleFamily
- Property subtype: Single Family Residence
Materials
- Stucco, Frame
- Foundation: Slab
- Roof: Tile
Condition
- Year built: 2020
Utilities & green energy
- Electric: Other
- Sewer: Public Sewer
- Water: Public
- Utilities for property: Public
Community & HOA
Location
- Region: Merced
Financial & listing details
- Price per square foot: $239/sqft
- Tax assessed value: $418,500
- Price range: $440K - $440K
- Date on market: 10/7/2026
Estimated market value
$438,000
$416,000 - $460,000
$2,084/mo
Price history
| Date | Event | Price |
|---|---|---|
| 10/7/2026 | Listed for sale | $439,950+7%$239/sqft |
Source: MetroList Services of CA #226122638 Report a problem | ||
| 5/1/2023 | Sold | $411,000-1%$223/sqft |
Source: MetroList Services of CA #222150472 Report a problem | ||
| 3/16/2023 | Pending sale | $415,000$225/sqft |
Source:  CRMLS #MC22260701 Report a problem | ||
| 12/29/2022 | Listed for sale | $415,000+43.8%$225/sqft |
Source: MetroList Services of CA #222150472 Report a problem | ||
| 7/28/2020 | Sold | $288,500+0%$157/sqft |
Source:  CRMLS #MC19192471 Report a problem | ||
| 6/16/2020 | Pending sale | $288,410$157/sqft |
Source: Advanced Market Realty, Inc #MC19192471 Report a problem | ||
| 6/11/2020 | Price change | $288,410-3.4%$157/sqft |
Source: Advanced Market Realty, Inc #MC19192471 Report a problem | ||
| 5/26/2020 | Price change | $298,410-2.6%$162/sqft |
Source: Advanced Market Realty, Inc #MC19192471 Report a problem | ||
| 2/24/2020 | Price change | $306,410+0.6%$166/sqft |
Source: Advanced Market Realty, Inc #MC19192471 Report a problem | ||
| 2/17/2020 | Price change | $304,510+1.7%$165/sqft |
Source: Advanced Market Realty, Inc #MC19192471 Report a problem | ||
| 2/14/2020 | Price change | $299,510+6.8%$163/sqft |
Source: Advanced Market Realty, Inc #MC19192471 Report a problem | ||
| 2/8/2020 | Price change | $280,410+6%$152/sqft |
Source: Advanced Market Realty, Inc #MC19192471 Report a problem | ||
| 8/13/2019 | Pending sale | $264,547$144/sqft |
Source: Advanced Market Realty, Inc #MC19192471 Report a problem | ||
| 8/12/2019 | Listed for sale | $264,547$144/sqft |
Source: Advanced Market Realty, Inc #MC19192471 Report a problem | ||
Public tax history
| Year | Property taxes | Tax assessment |
|---|---|---|
| 2026 | -- | $418,500 -2.1% |
| 2025 | $6,348 +4.4% | $427,604 +2% |
| 2024 | $6,080 +28.5% | $419,220 +39.9% |
| 2023 | $4,732 +2% | $299,635 +2% |
| 2022 | $4,640 +3.9% | $293,760 +2% |
| 2021 | $4,468 +31.2% | $288,000 +52.6% |
| 2020 | $3,405 +743.6% | $188,750 +433.6% |
| 2019 | $404 +3.5% | $35,373 +2% |
| 2018 | $390 +61.3% | $34,680 +63.9% |
| 2017 | $242 -0.8% | $21,161 +2% |
| 2016 | $244 +6% | $20,747 +1.5% |
| 2015 | $230 | $20,436 +2% |
| 2014 | $230 +33% | $20,036 +33.6% |
| 2013 | $173 | $15,000 +66.7% |
| 2012 | -- | $9,000 |
| 2011 | -- | $9,000 +28.6% |
| 2010 | -- | $7,000 -63.3% |
| 2009 | -- | $19,074 |
Find assessor info on the county website
Monthly payment
Est. payment
Payment breakdown
Explore the cost of this home by adjusting the details. Changes won't be saved.Climate risks
Neighborhood: 95341


Similar homes
- $419,9994 bd3 ba1.9k sqft594 Granada Ct, Merced, CA 95341For Sale
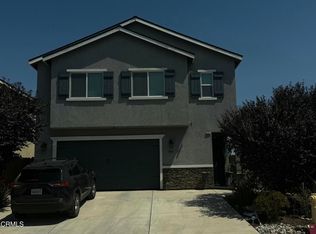 MLS ID #V1-38507, Robert Gonzales, One Source Real Estate. CRMLS
- $455,0004 bd2 ba1.8k sqft794 Dean Ct, Merced, CA 95341For Sale
 MLS ID #226081813, Alba Castaneda. MetroList Services of CA
- $365,0004 bd2 ba1.5k sqft178 La Purisima Ct, Merced, CA 95341For Sale
 MLS ID #MC26167368, Ranjeet Singh, Keller Williams Property Team. CRMLS
- $440,0004 bd3 ba1.8k sqft413 Hydrangea Ct, Merced, CA 95341For Sale
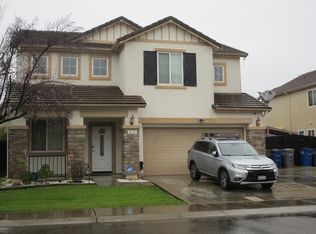 MLS ID #ML82035268, Ray Quintero. MLSListings Inc
