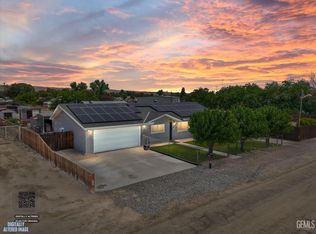
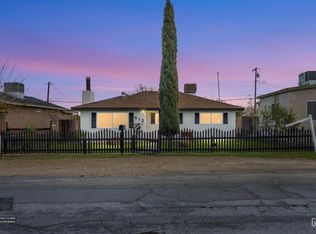
This 1696 square foot single family home has 3 bedrooms and 2.0 bathrooms. This home is located at 27588 Maple St, Taft, CA 93268.
Pre-foreclosure
Est. $358,300
27588 Maple St, Taft, CA 93268
3beds
2baths
1,696sqft
SingleFamily
Built in 1941
0.69 Acres Lot
$358,300 Zestimate®
$211/sqft
$-- HOA
Overview
- 63 days |
- 21 |
- 1 |
Facts & features
Interior
Bedrooms & bathrooms
- Bedrooms: 3
- Bathrooms: 2
Heating
- Forced air
Cooling
- Refrigerator
Interior area
- Total interior livable area: 1,696 sqft
Property
Parking
- Parking features: Garage - Detached
Lot
- Size: 0.69 Acres
Details
- Parcel number: 29823119
Construction
Type & style
- Home type: SingleFamily
Materials
- wood frame
Condition
- Year built: 1941
Community & HOA
Location
- Region: Taft
Financial & listing details
- Price per square foot: $211/sqft
- Tax assessed value: $170,668
- Annual tax amount: $2,802
Visit our professional directory to find a foreclosure specialist in your area that can help with your home search.
Find a foreclosure agentForeclosure details
Estimated market value
$358,300
$322,000 - $394,000
$2,105/mo
Price history
| Date | Event | Price |
|---|---|---|
| 2/9/2023 | Listing removed | -- |
Source: | ||
| 1/23/2023 | Listed for sale | $349,000$206/sqft |
Source: | ||
| 12/5/2022 | Listing removed | -- |
Source: | ||
| 9/15/2022 | Listed for sale | $349,000+211.6%$206/sqft |
Source: | ||
| 3/18/2019 | Sold | $112,000-53.3%$66/sqft |
Source: Public Record Report a problem | ||
| 1/5/2019 | Pending sale | -- |
Source: Hudson & Marshall Report a problem | ||
| 1/4/2019 | Listed for sale | -- |
Source: Hudson & Marshall Report a problem | ||
| 1/3/2019 | Pending sale | -- |
Source: Hudson & Marshall Report a problem | ||
| 12/29/2018 | Listed for sale | -- |
Source: Hudson & Marshall Report a problem | ||
| 12/21/2018 | Pending sale | -- |
Source: Hudson & Marshall Report a problem | ||
| 12/13/2018 | Listed for sale | -- |
Source: Hudson & Marshall Report a problem | ||
| 12/8/2018 | Pending sale | -- |
Source: Hudson & Marshall Report a problem | ||
| 12/6/2018 | Listed for sale | -- |
Source: Hudson & Marshall Report a problem | ||
| 12/5/2018 | Pending sale | -- |
Source: Hudson & Marshall Report a problem | ||
| 11/29/2018 | Listed for sale | -- |
Source: Hudson & Marshall Report a problem | ||
| 11/28/2018 | Pending sale | -- |
Source: Hudson & Marshall Report a problem | ||
| 9/28/2018 | Listed for sale | -- |
Source: Hudson & Marshall Report a problem | ||
| 7/4/2018 | Listing removed | -- |
Source: Hudson & Marshall Report a problem | ||
| 6/27/2018 | Listed for sale | -- |
Source: Hudson & Marshall Report a problem | ||
| 3/2/2006 | Sold | $240,000+100%$142/sqft |
Source: Public Record Report a problem | ||
| 7/8/2005 | Sold | $120,000+66.7%$71/sqft |
Source: Public Record Report a problem | ||
| 5/25/2005 | Sold | $72,000-12.7%$42/sqft |
Source: Public Record Report a problem | ||
| 2/28/1997 | Sold | $82,500$49/sqft |
Source: Public Record Report a problem | ||
Public tax history
| Year | Property taxes | Tax assessment |
|---|---|---|
| 2025 | $2,802 +3.8% | $170,668 +2% |
| 2024 | $2,701 +8.9% | $167,323 +2% |
| 2023 | $2,479 +6.7% | $164,043 +2% |
| 2022 | $2,324 | $160,828 +2% |
| 2021 | -- | $157,675 +1% |
| 2020 | $2,145 +3% | $156,060 +0.7% |
| 2019 | $2,083 +9.9% | $155,040 +6.2% |
| 2018 | $1,896 +12.7% | $146,000 +12.3% |
| 2017 | $1,682 -7.3% | $130,000 -0.8% |
| 2016 | $1,815 +33.8% | $131,000 +29.7% |
| 2015 | $1,357 +11.7% | $101,000 +12.2% |
| 2014 | $1,214 | $90,000 |
| 2013 | -- | $90,000 +63.6% |
| 2012 | $685 +2.4% | $55,000 |
| 2011 | $669 -57.6% | $55,000 -60.7% |
| 2010 | $1,577 -1.1% | $140,000 |
| 2009 | $1,594 -27.1% | $140,000 -29.4% |
| 2008 | $2,186 -18.4% | $198,167 -19% |
| 2007 | $2,680 +97.1% | $244,698 +103.9% |
| 2006 | $1,360 +16.5% | $120,000 +10% |
| 2005 | $1,167 +0.5% | $109,066 |
| 2004 | $1,161 +13.9% | $109,066 +1.9% |
| 2003 | $1,020 | $107,070 +15% |
| 2002 | $1,020 +11.7% | $93,111 +2% |
| 2001 | $913 | $91,287 |
| 2000 | -- | $91,287 |
Find assessor info on the county website
Monthly payment
Estimated monthly payment$1,822
All calculations are estimates and provided by Zillow, Inc. for informational purposes only. Actual amounts may vary.
HOA fees may include property taxes on listings classified as Co-Ops. Contact the listing agent and/or owner for fee details.
Mortgage interest rates are dependent on a number of factors, including credit score, down payment, and repayment length. Interest rate data provided by Zillow Group Marketplace, Inc. as of 1/1/1970 from various mortgage lenders with which we have lead or other similar arrangements; the Estimated Payment is an average of those rates.
See how much you could borrow to make a competitive offer.
Climate risks
Neighborhood: 93268
Nearby schools
GreatSchools rating
- 5/10Roosevelt Elementary SchoolGrades: 2-5Distance: 5.2 mi
- 3/10Lincoln Junior High SchoolGrades: 6-8Distance: 5.1 mi
- 4/10Taft Union High SchoolGrades: 9-12Distance: 5.4 mi


- California
- Kern County
- Taft
- 93268
- 27588 Maple St
Nearby cities
Nearby zip codes
Other Taft Topics
