Perched atop a hill in Fitchburg, this well-maintained three-family home offers breathtaking city views and a prime house hacking opportunity! Featuring two 2-bedroom units and a spacious 5-bedroom unit, this property is perfect for owner-occupants or investors looking for strong rental income. Each unit is in great condition, with updated features and plenty of natural light. Enjoy the convenience of off-street parking and easy access to local amenities. Don’t miss this rare chance to own a versatile property with amazing views and income potential!
Pending
$675,000
29 Mount Vernon St, Fitchburg, MA 01420
9beds
3,336sqft
3 Family - 3 Units Up/Down
Built in 1900
-- sqft lot
$716,700 Zestimate®
$202/sqft
$-- HOA
What's special
- 41 days
- 25
- 0
Zillow last checked:
Listing updated:
Listed by:
Marco Epifani 860-786-2854,
eRealty Advisors, Inc. 617-729-2618,
Marco Epifani 860-786-2854
Source: MLS PIN,MLS#: 73348252
Facts & features
Interior
Bedrooms & bathrooms
- Bedrooms: 9
- Bathrooms: 4
- Full bathrooms: 4
Features
- Basement: Full
- Has fireplace: No
Interior area
- Total structure area: 3,336
- Total interior livable area: 3,336 sqft
- Finished area above ground: 3,336
- Finished area below ground: 800
Property
Parking
- Total spaces: 4
- Uncovered spaces: 4
Features
- Has view: Yes
- View description: City View(s)
Lot
- Size: 6,086 Square Feet
Details
- Parcel number: FITCM0043B0064L0
- Zoning: RC
Construction
Type & style
- Home type: MultiFamily
- Property subtype: 3 Family - 3 Units Up/Down
Materials
- Foundation: Stone
Condition
- Year built: 1900
Utilities & green energy
- Sewer: Public Sewer
- Water: Public
Community & HOA
Location
- Region: Fitchburg
Financial & listing details
- Price per square foot: $202/sqft
- Tax assessed value: $4,227
- Annual tax amount: $6,260
- Date on market: 9/11/2026
- Total actual rent: 0
Estimated market value
$716,700
$667,000 - $767,000
$1,437/mo
Price history
| Date | Event | Price |
|---|---|---|
| 5/21/2026 | Pending sale | $699,000$210/sqft |
Source: MLS PIN #73487173 Report a problem | ||
| 4/17/2026 | Price change | $699,000-4.1%$210/sqft |
Source: MLS PIN #73487173 Report a problem | ||
| 3/31/2026 | Price change | $729,000-4%$219/sqft |
Source: MLS PIN #73487173 Report a problem | ||
| 3/16/2026 | Listed for sale | $759,000+12.4%$228/sqft |
Source: MLS PIN #73487173 Report a problem | ||
| 3/31/2025 | Price change | $675,000-3.6%$202/sqft |
Source: MLS PIN #73348252 Report a problem | ||
| 3/20/2025 | Listed for sale | $699,999+45.8%$210/sqft |
Source: MLS PIN #73348252 Report a problem | ||
| 12/12/2022 | Sold | $480,000+6.7%$144/sqft |
Source: MLS PIN #73053257 Report a problem | ||
| 11/2/2022 | Contingent | $449,900$135/sqft |
Source: MLS PIN #73053257 Report a problem | ||
| 10/28/2022 | Listed for sale | $449,900+400.4%$135/sqft |
Source: MLS PIN #73053257 Report a problem | ||
| 7/14/2017 | Listing removed | $700 |
Source: Zillow Rental Manager Report a problem | ||
| 6/23/2017 | Price change | $700+3.7% |
Source: Zillow Rental Manager Report a problem | ||
| 6/21/2017 | Listed for rent | $675 |
Source: Zillow Rental Manager Report a problem | ||
| 3/15/2012 | Listing removed | $89,900$27/sqft |
Source: Daniel J. Flynn Residential Sa #71324436 Report a problem | ||
| 1/8/2012 | Listed for sale | $89,900-47.9%$27/sqft |
Source: Daniel J. Flynn Residential Sa #71324436 Report a problem | ||
| 8/18/2010 | Listing removed | $172,500$52/sqft |
Source: Diane Dimacale #71090694 Report a problem | ||
| 6/11/2010 | Price change | $172,500-1.4%$52/sqft |
Source: Diane Dimacale #71090694 Report a problem | ||
| 6/5/2010 | Listed for sale | $175,000+182.3%$52/sqft |
Source: Diane Dimacale #71090694 Report a problem | ||
| 4/22/2009 | Sold | $62,000-31.9%$19/sqft |
Source: Public Record Report a problem | ||
| 7/2/2008 | Sold | $91,000+435.3%$27/sqft |
Source: Public Record Report a problem | ||
| 5/15/2003 | Sold | $17,000-76.2%$5/sqft |
Source: Public Record Report a problem | ||
| 5/17/2000 | Sold | $71,500+30.2%$21/sqft |
Source: Public Record Report a problem | ||
| 4/19/1996 | Sold | $54,900+27.7%$16/sqft |
Source: Public Record Report a problem | ||
| 5/18/1994 | Sold | $43,000$13/sqft |
Source: Public Record Report a problem | ||
Public tax history
| Year | Property taxes | Tax assessment |
|---|---|---|
| 2025 | $6,866 +9.7% | $508,200 +20.2% |
| 2024 | $6,260 +8.4% | $422,700 +17.3% |
| 2023 | $5,775 +30.1% | $360,500 +43.1% |
| 2022 | $4,438 +4.2% | $252,000 +12.6% |
| 2021 | $4,259 +5.8% | $223,800 +9.5% |
| 2020 | $4,027 +25.1% | $204,300 +30% |
| 2019 | $3,219 +10.1% | $157,100 +12.9% |
| 2018 | $2,925 +4.6% | $139,200 +7% |
| 2017 | $2,796 -0.1% | $130,100 -1.3% |
| 2016 | $2,798 +3.2% | $131,800 +0.5% |
| 2015 | $2,711 +1.9% | $131,100 -2.3% |
| 2014 | $2,661 +13% | $134,200 +8.6% |
| 2013 | $2,355 -2% | $123,600 -9.3% |
| 2012 | $2,402 -7.8% | $136,300 -15.2% |
| 2011 | $2,605 -1.3% | $160,800 -22.6% |
| 2009 | $2,638 0% | $207,700 -7.5% |
| 2008 | $2,639 +5.3% | $224,600 +3.5% |
| 2007 | $2,505 +2.9% | $217,100 +7.6% |
| 2006 | $2,434 +4.6% | $201,800 +11.4% |
| 2005 | $2,327 +21.1% | $181,100 +30.3% |
| 2004 | $1,921 +18.5% | $139,000 +35.1% |
| 2003 | $1,621 +7.4% | $102,900 +21.5% |
| 2001 | $1,509 -1.8% | $84,700 +0.4% |
| 2000 | $1,537 +4.3% | $84,400 -13.6% |
| 1996 | $1,474 | $97,700 |
Find assessor info on the county website
Monthly payment
Est. payment
Payment breakdown
Explore the cost of this home by adjusting the details. Changes won't be saved.Climate risks
Neighborhood: 01420


Similar homes
- $650,0009 bd3 ba3.7k sqft50 West St, Fitchburg, MA 01420For Sale
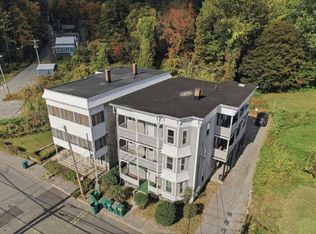 MLS ID #73590884, Lidiya Dimova, Lamacchia Realty, Inc.. MLS PIN
- $640,0006 bd2 ba3k sqft70 Prichard St, Fitchburg, MA 01420For Sale
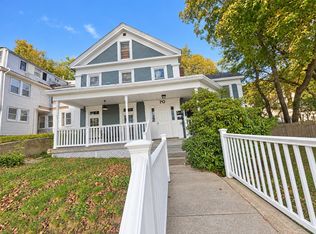 MLS ID #73580715, Dick Lee, eXp Realty LLC - Corporate Office. MLS PIN
- $665,0008 bd3 ba3k sqft21 Old Leominster Rd, Fitchburg, MA 01420For Sale
 MLS ID #73571515, Traci LaVanway, Coldwell Banker Realty - Leominster. MLS PIN
- $629,9998 bd2 ba4.3k sqft61 Congress St, Fitchburg, MA 01420For Sale
 MLS ID #73587349, MG Group, Century 21 North East. MLS PIN
