Great investment property! 1.2 miles to the entrance of Forest Park and 1 mile to the MGM Casino! Recent updates and Section 8 tenants come with this solid three-family with separate utilities!
Pending
$405,000
29 Warriner Ave, Springfield, MA 01108
6beds
2,813sqft
3 Family
Built in 1897
-- sqft lot
$345,900 Zestimate®
$144/sqft
$-- HOA
What's special
Recent updatesEntrance of forest park
- 795 days
- 5
- 0
Zillow last checked:
Listing updated:
Listed by:
Wayne Lawrence 413-530-3962,
Full Service 413-530-3962
Source: MLS PIN,MLS#: 72961789
Facts & features
Interior
Bedrooms & bathrooms
- Bedrooms: 6
- Bathrooms: 3
- Full bathrooms: 3
Features
- Basement: Full
- Has fireplace: No
Interior area
- Total structure area: 2,813
- Total interior livable area: 2,813 sqft
- Finished area above ground: 2,813
Property
Parking
- Total spaces: 3
- Parking features: Paved Drive
- Uncovered spaces: 3
Lot
- Size: 3,389 Square Feet
Details
- Parcel number: S:12000 P:0021,2610815
- Zoning: R3
Construction
Type & style
- Home type: MultiFamily
- Property subtype: 3 Family
Materials
- Foundation: Brick/Mortar
Condition
- Year built: 1897
Utilities & green energy
- Sewer: Public Sewer
- Water: Public
Community & HOA
Location
- Region: Springfield
Financial & listing details
- Price per square foot: $144/sqft
- Tax assessed value: $144,500
- Annual tax amount: $2,731
- Date on market: 9/11/2024
- Total actual rent: 3850
Estimated market value
$345,900
$301,000 - $387,000
$1,508/mo
Price history
| Date | Event | Price |
|---|---|---|
| 9/23/2026 | Pending sale | $405,000$144/sqft |
Source: MLS PIN #72961789 Report a problem | ||
| 1/10/2025 | Listed for sale | $405,000+19.5%$144/sqft |
Source: MLS PIN #72961789 Report a problem | ||
| 1/1/2025 | Listing removed | $339,000$121/sqft |
Source: MLS PIN #72961789 Report a problem | ||
| 3/1/2023 | Price change | $339,000+16.9%$121/sqft |
Source: MLS PIN #72961789 Report a problem | ||
| 12/14/2022 | Listed for sale | $290,000+5.5%$103/sqft |
Source: MLS PIN #72961789 Report a problem | ||
| 4/4/2022 | Listed for sale | $275,000+5.8%$98/sqft |
Source: MLS PIN #72961789 Report a problem | ||
| 3/21/2022 | Listing removed | $259,900$92/sqft |
Source: MLS PIN #72897435 Report a problem | ||
| 9/20/2021 | Listed for sale | $259,900+116.6%$92/sqft |
Source: MLS PIN #72897435 Report a problem | ||
| 6/1/2020 | Sold | $120,000+200%$43/sqft |
Source: Public Record Report a problem | ||
| 4/8/2015 | Sold | $40,000-19.2%$14/sqft |
Source: Public Record Report a problem | ||
| 1/4/2010 | Sold | $49,500+15.4%$18/sqft |
Source: Public Record Report a problem | ||
| 7/30/2009 | Listing removed | $42,900$15/sqft |
Source: foreclosure.com Report a problem | ||
| 7/15/2009 | Listed for sale | $42,900$15/sqft |
Source: foreclosure.com Report a problem | ||
| 5/3/2009 | Listing removed | $42,900$15/sqft |
Source: foreclosure.com Report a problem | ||
| 4/22/2009 | Listed for sale | $42,900-66.4%$15/sqft |
Source: foreclosure.com Report a problem | ||
| 3/30/2009 | Sold | $127,500-17.2%$45/sqft |
Source: Public Record Report a problem | ||
| 1/14/2005 | Sold | $154,000+71.1%$55/sqft |
Source: Public Record Report a problem | ||
| 6/14/2004 | Sold | $90,000+28.8%$32/sqft |
Source: Public Record Report a problem | ||
| 3/13/2003 | Sold | $69,902-12.6%$25/sqft |
Source: Public Record Report a problem | ||
| 10/7/1999 | Sold | $80,000-21.5%$28/sqft |
Source: Public Record Report a problem | ||
| 5/18/1999 | Sold | $101,965+7.3%$36/sqft |
Source: Public Record Report a problem | ||
| 3/17/1992 | Sold | $95,000$34/sqft |
Source: Public Record Report a problem | ||
Public tax history
| Year | Property taxes | Tax assessment |
|---|---|---|
| 2025 | $2,826 -7.3% | $180,200 -5% |
| 2024 | $3,047 +31.8% | $189,700 +39.9% |
| 2023 | $2,312 -22% | $135,600 -13.9% |
| 2022 | $2,964 +8.5% | $157,500 +9% |
| 2021 | $2,731 +1.3% | $144,500 +4.7% |
| 2020 | $2,695 +4.6% | $138,000 +5.4% |
| 2019 | $2,576 +6.6% | $130,900 +6.6% |
| 2018 | $2,417 +2.6% | $122,800 +2.5% |
| 2017 | $2,355 +23.6% | $119,800 +23.6% |
| 2016 | $1,905 +3.3% | $96,900 +3.3% |
| 2015 | $1,845 -7% | $93,800 -6.8% |
| 2014 | $1,983 +1.4% | $100,600 +1.4% |
| 2013 | $1,955 +0.8% | $99,200 +1.4% |
| 2012 | $1,939 +2.9% | $97,800 +1.1% |
| 2011 | $1,885 -13.8% | $96,700 -13.8% |
| 2010 | $2,188 -17.9% | $112,200 -24.7% |
| 2009 | $2,666 -9% | $149,000 -18.5% |
| 2008 | $2,930 -5.5% | $182,800 -5.4% |
| 2007 | $3,101 +21.7% | $193,300 +29% |
| 2006 | $2,548 +14% | $149,900 +17.4% |
| 2005 | $2,236 +123.4% | $127,700 +142.3% |
| 2004 | $1,001 -8.1% | $52,700 -6.1% |
| 2003 | $1,089 -7.2% | $56,100 -4.9% |
| 2002 | $1,173 | $59,000 |
Find assessor info on the county website
Monthly payment
Est. payment
Payment breakdown
Explore the cost of this home by adjusting the details. Changes won't be saved.Climate risks
Neighborhood: South End



Similar homes
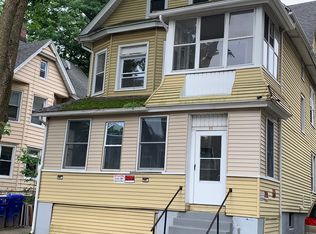
- $--6 bd3 ba2.3k sqft22 Sorrento St, Springfield, MA 01108Auction
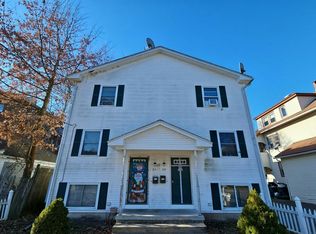 Auction.com 2
- $429,9006 bd3 ba2.9k sqft91-93 Malden St, Springfield, MA 01108For Sale
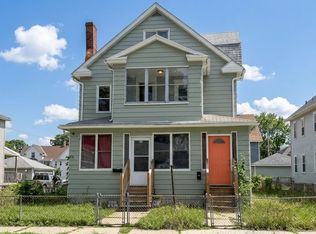 MLS ID #73571371, Paul Hernandez, Five Stars Realty LLC. MLS PIN
- $395,0006 bd2 ba2.6k sqft17-19 Trinity Ter, Springfield, MA 01108For Sale
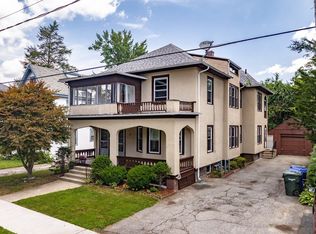 MLS ID #73575171, Tanisha Salmon, Keller Williams Realty. MLS PIN
- $450,0008 bd3 ba3.3k sqft48 Rutledge Ave, Springfield, MA 01105For Sale
 MLS ID #73600177, Patriot Living Group, Lock and Key Realty Inc.. MLS PIN
