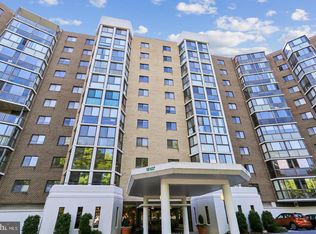
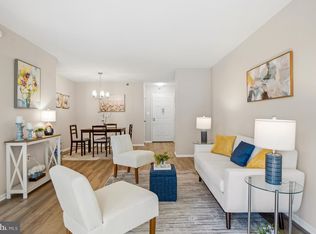
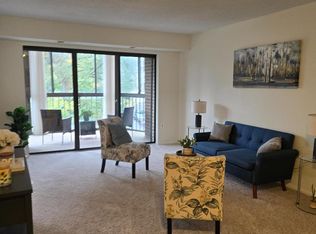
$145,000
2 bd2 ba953 sqft
2921 N Leisure World Blvd #1-122, Silver Spring, MD 20906
Sold

Likely to sell faster than
Zillow last checked:
Listing updated:
Nick DiNicola 410-218-7792,
Samson Properties 7033788810

$187,400
$178,000 - $197,000
$2,064/mo
| Date | Event | Price |
|---|---|---|
| 10/29/2026 | Listed for sale | $189,900+52%$199/sqft |
Source:  Bright MLS #MDMC2259976 Report a problem | ||
| 5/17/2016 | Sold | $124,900$131/sqft |
Source: Public Record Report a problem | ||
| 4/4/2016 | Pending sale | $124,900$131/sqft |
Source: Long & Foster Real Estate, Inc. #MC9611339 Report a problem | ||
| 3/31/2016 | Listed for sale | $124,900+64.3%$131/sqft |
Source: Long & Foster Real Estate, Inc. #MC9611339 Report a problem | ||
| 1/12/2016 | Sold | $76,000-4.9%$80/sqft |
Source: Public Record Report a problem | ||
| 10/29/2015 | Listed for sale | $79,900$84/sqft |
Source: Washington Area Properties, LLC #MC8664335 Report a problem | ||
| 9/30/2015 | Pending sale | $79,900$84/sqft |
Source: Washington Area Properties, LLC #MC8664335 Report a problem | ||
| 9/4/2015 | Price change | $79,900-20%$84/sqft |
Source: Washington Area Properties LLC #MC8664335 Report a problem | ||
| 8/20/2015 | Price change | $99,900-9.1%$105/sqft |
Source: Washington Area Properties LLC #MC8664335 Report a problem | ||
| 7/12/2015 | Price change | $109,900-12%$115/sqft |
Source: Washington Area Properties LLC #MC8664335 Report a problem | ||
| 6/12/2015 | Listed for sale | $124,900+86.2%$131/sqft |
Source: Washington Area Properties, LLC #MC8664335 Report a problem | ||
| 12/29/2014 | Sold | $67,073-25.5%$70/sqft |
Source: Public Record Report a problem | ||
| 12/8/2000 | Sold | $90,000$94/sqft |
Source: Public Record Report a problem | ||
| Year | Property taxes | Tax assessment |
|---|---|---|
| 2026 | $1,937 +1.7% | $158,333 +1.1% |
| 2025 | $1,905 +6.8% | $156,667 +1.1% |
| 2024 | $1,784 +9.3% | $155,000 +9.4% |
| 2023 | $1,632 +15.3% | $141,667 +10.4% |
| 2022 | $1,416 +11.7% | $128,333 +11.6% |
| 2021 | $1,268 +4.5% | $115,000 +4.5% |
| 2020 | $1,214 +10% | $110,000 +10% |
| 2019 | $1,103 -0.2% | $100,000 |
| 2018 | $1,105 +4.8% | $100,000 +13.2% |
| 2017 | $1,054 +178.3% | $88,333 +15.2% |
| 2016 | $379 | $76,667 +17.9% |
| 2015 | $379 | $65,000 |
| 2014 | $379 | $65,000 |
| 2013 | -- | $65,000 -31.6% |
| 2012 | -- | $95,000 |
| 2011 | -- | $95,000 |
| 2010 | -- | $95,000 -48.6% |
| 2009 | -- | $185,000 +9.9% |
| 2008 | -- | $168,332 +11% |
| 2007 | -- | $151,666 +12.3% |
| 2006 | -- | $135,000 +12.8% |
| 2005 | -- | $119,666 +14.7% |
| 2004 | -- | $104,333 +17.2% |
| 2003 | -- | $89,000 |
| 2002 | -- | $89,000 |
| 2001 | -- | $89,000 |
Source: Bright MLS. This data may not be complete. We recommend contacting the local school district to confirm school assignments for this home.

A local agent can set up tours, give advice and negotiate with sellers.