Bring your vision to make this lovely Imperial Village home yours! 3 bedrooms, 2 full baths, large family room, living room, kitchen and enclosed patio. Newer water heater and flooring in the living room and kitchen. Being sold AS IS from an estate.
Active
$209,900
2943 Malibu St, Springfield, OH 45503
3beds
1,435sqft
Single Family Residence
Built in 1971
9,583 Square Feet Lot
$206,600 Zestimate®
$146/sqft
$-- HOA
What's special
Enclosed patioLarge family room
- 2 days
- 450
- 27
Likely to sell faster than
Zillow last checked:
Listing updated:
Listed by:
Natalie M. Jackson 937-324-3212,
Mumma Realty and Auctioneers,
Curtis Mumma 937-324-3212,
Mumma Realty and Auctioneers
Source: WRIST,MLS#: 1049716
Facts & features
Interior
Bedrooms & bathrooms
- Bedrooms: 3
- Bathrooms: 2
- Full bathrooms: 2
Heating
- Natural Gas
Cooling
- Central Air
Features
- Basement: None
- Number of fireplaces: 1
- Fireplace features: One Fireplace
Interior area
- Total structure area: 1,435
- Total interior livable area: 1,435 sqft
Video & virtual tour
Property
Parking
- Total spaces: 2
- Parking features: Garage - Attached
- Attached garage spaces: 2
Features
- Levels: One
- Stories: 1
- Patio & porch: Porch, Patio
Lot
- Size: 9,583 Square Feet
- Dimensions: 80 x 120
- Features: Residential Lot
Details
- Parcel number: 3400300025115012
- Zoning description: Residential
Construction
Type & style
- Home type: SingleFamily
- Property subtype: Single Family Residence
Materials
- Brick
Condition
- Year built: 1971
Utilities & green energy
- Sewer: Public Sewer
- Water: Supplied Water
Community & HOA
Community
- Subdivision: Northridge 15
HOA
- Has HOA: No
Location
- Region: Springfield
Financial & listing details
- Price per square foot: $146/sqft
- Tax assessed value: $182,540
- Annual tax amount: $1,893
- Date on market: 11/11/2026
- Listing terms: Conventional
Estimated market value
$206,600
$196,000 - $217,000
$1,686/mo
Price history
| Date | Event | Price |
|---|---|---|
| 11/11/2026 | Listed for sale | $209,900+72%$146/sqft |
Source:  WRIST #1049716 Report a problem | ||
| 5/8/2008 | Sold | $122,000-8.2%$85/sqft |
Source: Public Record Report a problem | ||
| 8/21/2001 | Sold | $132,900+16.3%$93/sqft |
Source: Public Record Report a problem | ||
| 9/4/1997 | Sold | $114,250$80/sqft |
Source: Public Record Report a problem | ||
Public tax history
| Year | Property taxes | Tax assessment |
|---|---|---|
| 2025 | $1,893 +22.9% | $63,890 +26% |
| 2024 | $1,541 -1.4% | $50,720 |
| 2023 | $1,563 -4.7% | $50,720 |
| 2022 | $1,641 +33.3% | $50,720 +25.3% |
| 2021 | $1,231 -0.2% | $40,480 |
| 2020 | $1,234 -0.2% | $40,480 |
| 2019 | $1,237 -22.7% | $40,480 -11.8% |
| 2018 | $1,601 | $45,910 +15.8% |
| 2017 | $1,601 -23.5% | $39,652 |
| 2016 | $2,091 +47.3% | $39,652 +8.1% |
| 2015 | $1,420 | $36,674 |
| 2014 | $1,420 +1.5% | $36,674 |
| 2013 | $1,399 -37% | $36,674 -10.7% |
| 2012 | $2,221 -2% | $41,076 |
| 2011 | $2,266 +4.7% | $41,076 |
| 2010 | $2,165 +1.1% | $41,076 -5% |
| 2009 | $2,142 +29% | $43,239 |
| 2008 | $1,660 +226.1% | $43,239 |
| 2007 | $509 -60.8% | $43,239 +0.5% |
| 2006 | $1,299 +31% | $43,033 |
| 2005 | $992 -70.2% | $43,033 +0% |
| 2004 | $3,334 +7.1% | $43,030 +9% |
| 2003 | $3,113 -0.2% | $39,480 |
| 2002 | $3,119 +18.6% | $39,480 +17.2% |
| 2000 | $2,630 | $33,680 |
Find assessor info on the county website
Monthly payment
Est. payment
Payment breakdown
Explore the cost of this home by adjusting the details. Changes won't be saved.Climate risks
Neighborhood: 45503


Similar homes
- $--3 bd2 ba1.9k sqft3301 Kappel Dr, Springfield, OH 45503Auction
 Auction.com 2
- $200,0003 bd2 ba1.2k sqft2717 Seymour Ln, Springfield, OH 45503For Sale
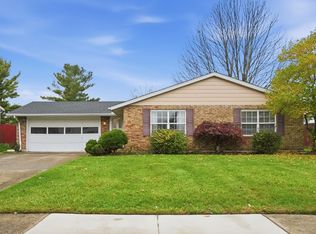
 MLS ID #1049773, Douglas J. Acton, Key Realty. WRIST
- $180,9604 bd2 ba1.6k sqft2351 Kingswood Dr W, Springfield, OH 45503Auction
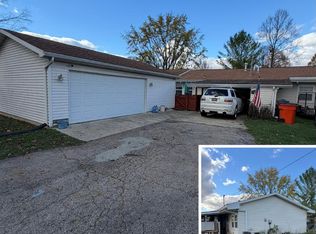 MLS ID #1049673, Jeff S. Harvey, Harvey Plus. WRIST
- $--3 bd2 ba1.2k sqft2918 Brewster Ct, Springfield, OH 45503Auction
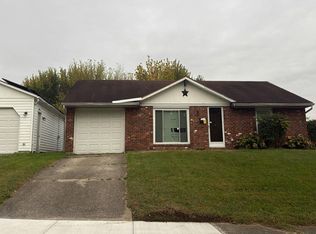 Auction.com 2
- $200,0003 bd1 ba1.1k sqft1001 Robin Rd, Springfield, OH 45503For Sale
 MLS ID #972070, Lisa Smedley, Home City Real Estate. DABR MLS
- $215,0003 bd1 ba1.1k sqft2605 Casey Dr, Springfield, OH 45503For SaleMLS ID #1049396, Sadrac Delva, eXp Realty. WRIST
- $239,0003 bd2 ba1.1k sqft2461 Erter Dr, Springfield, OH 45503For SaleMLS ID #1049566, Jamie S. Colyer, Coldwell Banker Heritage. WRIST
- $220,0003 bd1 ba1.1k sqft700 E Home Rd, Springfield, OH 45503For SaleMLS ID #972516, Arthur Solomon, Coldwell Banker Heritage. DABR MLS
- $239,9003 bd2 ba1k sqft4848 Curtis Dr, Springfield, OH 45503For SaleMLS ID #972532, Arthur Solomon, Coldwell Banker Heritage. DABR MLS
- $210,0002 bd2 ba1.3k sqft1011 Abington Pl, Springfield, OH 45503For SaleMLS ID #968498, Janet L Miller, RE/MAX HomeBase. DABR MLS
- $196,9003 bd1 ba1.3k sqft1508 Garfield Ave, Springfield, OH 45504For SaleMLS ID #972101, Lisa Smedley, Home City Real Estate. DABR MLS
- $197,0002 bd1 ba1k sqft1408 Torrence Dr, Springfield, OH 45503For SaleMLS ID #972104, Christina Parke, Keller Williams Community Part. DABR MLS
- $279,9004 bd2 ba1.2k sqft4443 Tulane Rd, Springfield, OH 45503For SaleMLS ID #1049739, Megan Florence, Howard Hanna Real Estate Services. WRIST
- $188,6753 bd1 ba950 sqft3208 Tackett St, Springfield, OH 45503For SaleMLS ID #964221, Jason Hodge, Coldwell Banker Heritage. DABR MLS
- $126,8303 bd1 ba1k sqft540 Kingswood Dr N, Springfield, OH 45503AuctionMLS ID #1049672, Jeff S. Harvey, Harvey Plus. WRIST
- $195,0002 bd2 ba1.3k sqft3059 Brixton Dr W, Springfield, OH 45503For Sale
 MLS ID #226042009, Mark H Sotherden, EMC Realty LLC. Columbus and Central Ohio Regional MLS
- $210,0003 bd1 ba1.7k sqft2020 Winding Trl, Springfield, OH 45503For SaleMLS ID #1045590, Jack Irwin Blain, Real Estate II, Inc.. WRIST
- $189,9002 bd1 ba1.1k sqft2683 Home Orchard Dr, Springfield, OH 45503For SaleMLS ID #969021, Jeff Horne, Coldwell Banker Heritage. DABR MLS
- $205,0002 bd3 ba1.7k sqft3118 El Camino Dr, Springfield, OH 45503For SaleMLS ID #971842, Robbie Segrest, BHHS Professional Realty. DABR MLS
