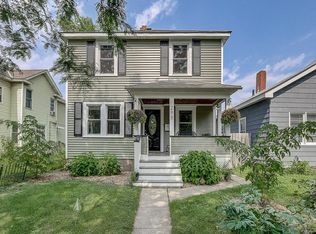
Investment property. Up-down duplex in St. Paul needing clean out and repairs. Has not been rented but considered owner occupied.
Buyer to verify all measurements.
Active
$150,000
299 Harrison Ave, Saint Paul, MN 55102
4beds
2baths
1,519sqft
Duplex Up and Down
Built in 1884
-- sqft lot
$-- Zestimate®
$99/sqft
$-- HOA
What's special
- 8 days
- 688
- 38
Likely to sell faster than
Zillow last checked:
Listing updated:
Listed by:
Brett D. Foss 952-431-1095,
S | L | M Realty,
Liz Schelske 952-457-3008
Source: NorthstarMLS as distributed by MLS GRID,MLS#: 7156948
Facts & features
Interior
Bedrooms & bathrooms
- Bedrooms: 4
- Bathrooms: 2
Heating
- Boiler
Appliances
- Laundry: Lower Level
Features
- Basement: Unfinished
Interior area
- Total structure area: 2,582
- Total interior livable area: 1,519 sqft
- Finished area above ground: 1,519
- Finished area below ground: 0
Property
Parking
- Total spaces: 2
- Parking features: Detached Garage
- Garage spaces: 2
Accessibility
- Accessibility features: None
Features
- Levels: Two
- Patio & porch: Front Porch
- Fencing: Wire
Lot
- Size: 6,011 Square Feet
- Dimensions: 49 x 123
Details
- Foundation area: 2157
- Parcel number: 012823420040
- Zoning description: Residential-Multi-Family
Construction
Type & style
- Home type: MultiFamily
- Property subtype: Duplex Up and Down
Materials
- Stone
- Roof: Age Over 8 Years,Asphalt
Condition
- New construction: No
- Year built: 1884
Utilities & green energy
- Electric: 100 Amp Service, Power Company: Xcel Energy
- Gas: Natural Gas
- Sewer: City Sewer/Connected
- Water: City Water/Connected
Community & HOA
Community
- Subdivision: Whitacre Brisbine & Mullens Sub
HOA
- Amenities included: Laundry
Location
- Region: Saint Paul
Financial & listing details
- Price per square foot: $99/sqft
- Tax assessed value: $283,800
- Annual tax amount: $5,808
- Date on market: 10/12/2026
- Cumulative days on market: 9 days
- Tenant pays: Cable TV, Telephone
Estimated market value
Not available
Estimated sales range
Not available
Not available
Price history
| Date | Event | Price |
|---|---|---|
| 10/12/2026 | Listed for sale | $150,000+126.6%$99/sqft |
Source:  NorthstarMLS as distributed by MLS GRID #7156948 Report a problem | ||
| 4/26/1993 | Sold | $66,200$44/sqft |
Source: Agent Provided Report a problem | ||
Public tax history
| Year | Property taxes | Tax assessment |
|---|---|---|
| 2026 | $5,808 +12.2% | $283,800 -8.7% |
| 2025 | $5,176 +9.8% | $310,900 +0.7% |
| 2024 | $4,716 +5.9% | $308,700 +2.9% |
| 2023 | $4,454 +21.7% | $300,100 +7.1% |
| 2022 | $3,660 +4.8% | $280,100 +20.5% |
| 2021 | $3,492 +14.2% | $232,400 +2.5% |
| 2020 | $3,059 +21.4% | $226,700 +13.2% |
| 2019 | $2,520 | $200,300 |
| 2018 | $2,520 -6.2% | $200,300 +15% |
| 2017 | $2,686 | $174,200 |
| 2016 | $2,686 +18.3% | -- |
| 2015 | $2,270 +28.2% | $152,900 |
| 2014 | $1,770 -6.9% | -- |
| 2013 | $1,902 -6.6% | -- |
| 2012 | $2,036 -15.5% | -- |
| 2011 | $2,410 | -- |
| 2010 | -- | -- |
| 2009 | $2,708 +17.1% | -- |
| 2008 | $2,312 +16.1% | -- |
| 2007 | $1,992 +6.1% | -- |
| 2006 | $1,878 +34.7% | -- |
| 2005 | $1,394 +17.9% | -- |
| 2004 | $1,182 +20.4% | -- |
| 2003 | $982 +16.9% | -- |
| 2002 | $840 -11.2% | -- |
| 2001 | $946 +16.1% | -- |
| 2000 | $815 | -- |
Find assessor info on the county website
Monthly payment
Est. payment
Payment breakdown
Explore the cost of this home by adjusting the details. Changes won't be saved.Climate risks
Neighborhood: West 7th

Similar homes
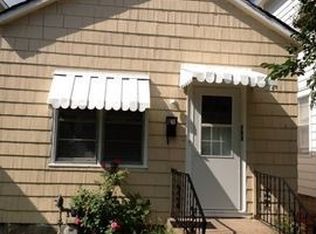
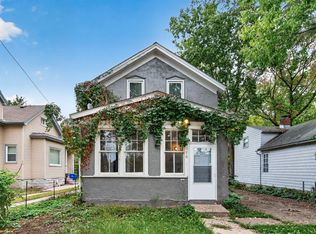
- $150,0003 bd2 ba1.5k sqft376 Erie St, Saint Paul, MN 55102For Sale
 MLS ID #7018986, Shae Hanson, Keller Williams Realty Integrity Lakes. NorthstarMLS as distributed by MLS GRID
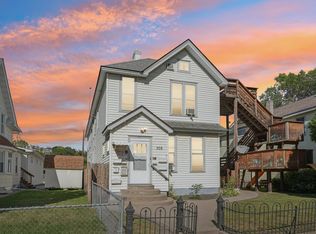
- $169,9004 bd2 ba1.7k sqft313 Edmund Ave, Saint Paul, MN 55103For Sale
 MLS ID #7126537, Bryce Cash, RE/MAX Results. NorthstarMLS as distributed by MLS GRID
- $165,0002 bd1 ba1k sqft311 Pleasant Ave APT 509, Saint Paul, MN 55102For Sale
 MLS ID #7142068, Angela R Hammond, RE/MAX Results. NorthstarMLS as distributed by MLS GRID
- $150,0003 bd2 ba1.1k sqft1007 Victoria St N, Saint Paul, MN 55103For Sale
 MLS ID #7154127, Perry Hurth, Keller Williams Realty Integrity. NorthstarMLS as distributed by MLS GRID
- $144,9003 bd1 ba1.1k sqft535 Edmund Ave, Saint Paul, MN 55103For SaleMLS ID #7143047, Eric J Eickhof, Jason Mitchell Group. NorthstarMLS as distributed by MLS GRID
- $160,0001 bd1 ba859 sqft350 Saint Peter St Unit 508, Saint Paul, MN 55102For SaleMLS ID #7139228, Joyce S. Peterson, Coldwell Banker Realty. NorthstarMLS as distributed by MLS GRID
- $219,9005 bd2 ba1.7k sqft467 Beaumont St, Saint Paul, MN 55130For SaleMLS ID #7147588, Ineye Bobmanuel, Keller Williams Realty Integrity Lakes. NorthstarMLS as distributed by MLS GRID
- $215,0004 bd2 ba1.5k sqft659 Edmund Ave, Saint Paul, MN 55104For SaleMLS ID #7160235, Scott Swennes, RE/MAX Results. NorthstarMLS as distributed by MLS GRID
- $175,0001 bd1 ba875 sqft350 Saint Peter St Unit 903, Saint Paul, MN 55102For SaleMLS ID #7130157, Randi Dahl, Keller Williams Premier Realty. NorthstarMLS as distributed by MLS GRID
- $155,0001 bd1 ba950 sqft641 Marshall Ave APT 4, Saint Paul, MN 55104For SaleMLS ID #7162731, Jeffrey Simek, Edina Realty, Inc.. NorthstarMLS as distributed by MLS GRID
- $129,9004 bd1 ba1.2k sqft304 Marshall Ave APT 5, Saint Paul, MN 55102For SaleMLS ID #6759063, Ed A Dropps IV, Realty ONE Group Choice. NorthstarMLS as distributed by MLS GRID
- $170,0001 bd1 ba1.1k sqft443 Dayton Ave APT 10, Saint Paul, MN 55102For SaleMLS ID #7093104, Allison Deal, Pemberton RE. NorthstarMLS as distributed by MLS GRID
- $192,0003 bd2 ba1.2k sqft760 Minnehaha Ave E, Saint Paul, MN 55106For SaleMLS ID #7162870, Greg E. Hilger, RE/MAX Advantage Plus. NorthstarMLS as distributed by MLS GRID
- $181,5003 bd2 ba1.7k sqft87 Cook Ave W, Saint Paul, MN 55117For SaleMLS ID #7162349, Peter F. Hao, Longhouse Realty. NorthstarMLS as distributed by MLS GRID
- $144,9002 bd1 ba1.5k sqft565 Hatch Ave, Saint Paul, MN 55117For SaleMLS ID #7157133, Betsey I. Jeans, RE/MAX Synergy. NorthstarMLS as distributed by MLS GRID
- $182,5003 bd2 ba1.4k sqft813 Minnehaha Ave W, Saint Paul, MN 55104For SaleMLS ID #7140228, Lasha S Raddatz, Keller Williams Realty Integrity Lakes. NorthstarMLS as distributed by MLS GRID
- $149,0002 bd1 ba805 sqft78 10th St E Unit 1909, Saint Paul, MN 55101For SaleMLS ID #7104585, The Foy-Cross Group, Keller Williams Realty Integrity Lakes. NorthstarMLS as distributed by MLS GRID
- $219,9004 bd2 ba1.7k sqft743 Charles Ave, Saint Paul, MN 55104For SaleMLS ID #7160466, Khai H. Lim, Fish MLS Realty. NorthstarMLS as distributed by MLS GRID
