*Seller will consider a contract for deed with 10% down*. Check out this fantastic opportunity for owner-occupants or first-time investors. It easily exceeds the 1% rule, offering off-street parking and a spacious yard to enjoy. The home is roomy with open layouts and plenty of original charm. Don’t wait to call!
Active
$219,900
467 Beaumont St, Saint Paul, MN 55130
5beds
2baths
1,715sqft
Duplex Up and Down
Built in 1884
-- sqft lot
$218,200 Zestimate®
$128/sqft
$-- HOA
What's special
- 7 days
- 118
- 7
Zillow last checked:
Listing updated:
Listed by:
Ineye Bobmanuel 612-203-4132,
Keller Williams Realty Integrity Lakes
Source: NorthstarMLS as distributed by MLS GRID,MLS#: 7147588
Facts & features
Interior
Bedrooms & bathrooms
- Bedrooms: 5
- Bathrooms: 2
Heating
- Baseboard, Forced Air
Appliances
- Laundry: In Unit
Features
- Basement: Crawl Space
Interior area
- Total structure area: 2,165
- Total interior livable area: 1,715 sqft
- Finished area above ground: 1,715
- Finished area below ground: 0
Property
Parking
- Parking features: Driveway - Other Surface
- Has uncovered spaces: Yes
Accessibility
- Accessibility features: None
Features
- Levels: Two
- Fencing: Chain Link
Lot
- Size: 5,227 Square Feet
- Dimensions: 40 x 131
- Features: Infill Lot
Details
- Foundation area: 1101
- Parcel number: 322922210072
- Zoning description: Residential-Multi-Family
Construction
Type & style
- Home type: MultiFamily
- Property subtype: Duplex Up and Down
Materials
- Frame
- Roof: Age Over 8 Years
Condition
- New construction: No
- Year built: 1884
Utilities & green energy
- Electric: 100 Amp Service, Power Company: Xcel Energy
- Gas: Natural Gas
- Sewer: City Sewer/Connected
- Water: City Water/Connected
Community & HOA
Community
- Subdivision: Sub Of & Add To Irvines Add
Location
- Region: Saint Paul
Financial & listing details
- Price per square foot: $128/sqft
- Tax assessed value: $249,400
- Annual tax amount: $5,284
- Date on market: 10/16/2026
- Tenant pays: Electricity, Gas, Telephone
Estimated market value
$218,200
$207,000 - $229,000
$2,019/mo
Price history
| Date | Event | Price |
|---|---|---|
| 10/19/2026 | Listed for sale | $219,900+15.1%$128/sqft |
Source:  NorthstarMLS as distributed by MLS GRID #7147588 Report a problem | ||
| 12/1/2023 | Sold | $191,000-4.5%$111/sqft |
Source: NorthstarMLS as distributed by MLS GRID #6433940 Report a problem | ||
| 11/8/2023 | Pending sale | $199,900$117/sqft |
Source: NorthstarMLS as distributed by MLS GRID #6433940 Report a problem | ||
| 9/17/2023 | Listed for sale | $199,900-7%$117/sqft |
Source: NorthstarMLS as distributed by MLS GRID #6433940 Report a problem | ||
| 2/15/2023 | Listing removed | -- |
Source: NorthstarMLS as distributed by MLS GRID #6254353 Report a problem | ||
| 9/21/2022 | Listed for sale | $215,000+53.6%$125/sqft |
Source: NorthstarMLS as distributed by MLS GRID #6254353 Report a problem | ||
| 12/8/2021 | Listing removed | -- |
Source: NorthstarMLS as distributed by MLS GRID #5695124 Report a problem | ||
| 5/14/2021 | Sold | $140,000-33.3%$82/sqft |
Source: NorthstarMLS as distributed by MLS GRID #5695124 Report a problem | ||
| 3/9/2021 | Pending sale | $209,900$122/sqft |
Source: NorthstarMLS as distributed by MLS GRID #5695124 Report a problem | ||
| 6/25/2020 | Listed for sale | $209,900+179.9%$122/sqft |
Source: RE/MAX Results #5610566 Report a problem | ||
| 4/24/2019 | Sold | $75,000+50%$44/sqft |
Source: Public Record Report a problem | ||
| 1/27/2011 | Sold | $50,000+66.7%$29/sqft |
Source: Public Record Report a problem | ||
| 3/2/2009 | Sold | $30,000+31%$17/sqft |
Source: Public Record Report a problem | ||
| 12/23/2008 | Sold | $22,900-84.2%$13/sqft |
Source:  Lake Superior Area Realtors as distributed by MLS GRID #1688764 Report a problem | ||
| 7/2/2003 | Sold | $145,000+11.7%$85/sqft |
Source: Public Record Report a problem | ||
| 9/17/2001 | Sold | $129,800+188.4%$76/sqft |
Source: Public Record Report a problem | ||
| 10/13/1997 | Sold | $45,000+32.4%$26/sqft |
Source: Public Record Report a problem | ||
| 5/28/1997 | Sold | $34,000$20/sqft |
Source: Public Record Report a problem | ||
Public tax history
| Year | Property taxes | Tax assessment |
|---|---|---|
| 2026 | $5,284 +21.6% | $249,400 +7.8% |
| 2025 | $4,346 +43.9% | $231,300 +9.9% |
| 2024 | $3,020 -20.1% | $210,500 +7.5% |
| 2023 | $3,778 +17% | $195,800 +9.9% |
| 2022 | $3,230 +47.2% | $178,200 +15.8% |
| 2021 | $2,194 +13.6% | $153,900 +54.4% |
| 2020 | $1,931 +33.5% | $99,700 +20.4% |
| 2019 | $1,447 | $82,800 |
| 2018 | $1,447 -16.3% | $82,800 +14.8% |
| 2017 | $1,728 | $72,100 |
| 2016 | $1,728 +37.1% | -- |
| 2015 | $1,260 -7.1% | $56,900 |
| 2014 | $1,356 -1% | -- |
| 2013 | $1,370 -5.1% | -- |
| 2012 | $1,444 +33% | -- |
| 2011 | $1,086 | -- |
| 2010 | -- | -- |
| 2009 | $2,192 +15.7% | -- |
| 2008 | $1,894 +14.9% | -- |
| 2007 | $1,648 +15.1% | -- |
| 2006 | $1,432 +32.8% | -- |
| 2005 | $1,078 +32.1% | -- |
| 2004 | $816 +18.6% | -- |
| 2003 | $688 +15.1% | -- |
| 2002 | $598 -26.2% | -- |
| 2001 | $810 +33.5% | -- |
| 2000 | $607 | -- |
Find assessor info on the county website
Monthly payment
Est. payment
Payment breakdown
Explore the cost of this home by adjusting the details. Changes won't be saved.Climate risks
Neighborhood: Payne Phalen


Similar homes
- $--4 bd2 ba1.8k sqft608 Beaumont St, Saint Paul, MN 55130Auction
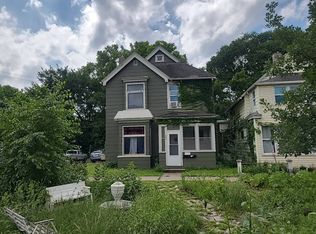 Auction.com 1
- $264,9006 bd3 ba2.3k sqft591 Payne Ave, Saint Paul, MN 55130For Sale
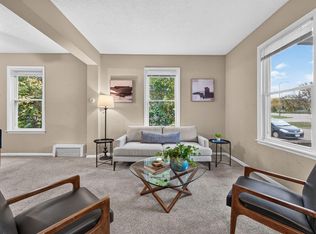
 MLS ID #7158681, Shae Hanson, Keller Williams Realty Integrity Lakes. NorthstarMLS as distributed by MLS GRID
- $224,9004 bd2 ba1.8k sqft365 Case Ave, Saint Paul, MN 55130For Sale
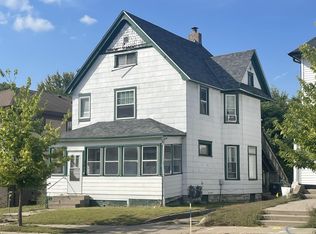 MLS ID #7095689, Nicole L Stone, RE/MAX Results. NorthstarMLS as distributed by MLS GRID
- $249,0006 bd2 ba1.5k sqft701 Desoto St, Saint Paul, MN 55130For Sale
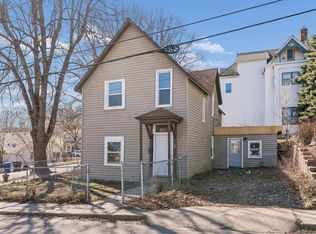 MLS ID #7044104, Ashley Trulson, Keller Williams Classic Rlty NW. NorthstarMLS as distributed by MLS GRID
- $224,9002 bd2 ba1.4k sqft1136 Edgerton St, Saint Paul, MN 55130For SaleMLS ID #7104938, Joe Collins, Housing Hub LLC. NorthstarMLS as distributed by MLS GRID
- $220,0003 bd2 ba1.2k sqft574 Brunson St, Saint Paul, MN 55130For SaleMLS ID #7144406, Shannon VanBurkleo, Coldwell Banker Realty - Southwest Regional. NorthstarMLS as distributed by MLS GRID
- $210,0002 bd2 ba1.3k sqft620 Cook Ave E, Saint Paul, MN 55130For SaleMLS ID #7144985, Sedat Memetov, eXp Realty. NorthstarMLS as distributed by MLS GRID
- $259,9004 bd2 ba1.7k sqft929 6th St E, Saint Paul, MN 55106For SaleMLS ID #7149106, Stan Weber, RE/MAX Results. NorthstarMLS as distributed by MLS GRID
- $215,0003 bd2 ba1.2k sqft626 Magnolia Ave E, Saint Paul, MN 55130For SaleMLS ID #7156208, Angela M. Lapinski, Bridge Realty, LLC. NorthstarMLS as distributed by MLS GRID
- $170,0004 bd2 ba1.7k sqft596 Case Ave, Saint Paul, MN 55130For SaleMLS ID #7135822, Alex Malard, eXp Realty. NorthstarMLS as distributed by MLS GRID
- $240,0003 bd2 ba1.2k sqft474 Hopkins St, Saint Paul, MN 55130For SaleMLS ID #7124484, Joshua Kirchert, LPT Realty, LLC. NorthstarMLS as distributed by MLS GRID
- $259,0004 bd5 ba1.3k sqft612 Bush Ave, Saint Paul, MN 55130For SaleMLS ID #7129774, Ivonne Delgado Kuri, National Realty Guild. NorthstarMLS as distributed by MLS GRID
- $179,9004 bd2 ba1.8k sqft588 York Ave, Saint Paul, MN 55130For SaleMLS ID #7150052, JoAnn White, Ashworth Real Estate. NorthstarMLS as distributed by MLS GRID
- $275,0004 bd2 ba2k sqft696 5th St E, Saint Paul, MN 55106For SaleMLS ID #7159211, Jado Hark, Compass. NorthstarMLS as distributed by MLS GRID
- $192,0003 bd2 ba1.2k sqft760 Minnehaha Ave E, Saint Paul, MN 55106For SaleMLS ID #7162870, Greg E. Hilger, RE/MAX Advantage Plus. NorthstarMLS as distributed by MLS GRID
