Beautiful 4 bed , 1 1/2 bath, finished basement, new furnace, newer windows, hardwood floors, large family room, beautiful wood burning fireplace, and bonus large enclosed patio, fenced yard and a 12x16 shed with 120/240 power. 2 1/2 car attached garage with new door. Many newer updates, 2nd owner of home since 1979. Very well kept. Move in ready, all appliances stay. Close to I 75.
For sale by owner
$329,900
30358 Dover St, Flat Rock, MI 48134
4beds
1,635sqft
SingleFamily
Built in 1977
7,535 Square Feet Lot
$294,747 Zestimate®
$202/sqft
$-- HOA
What's special
Fenced yardFinished basementHardwood floorsBeautiful wood burning fireplaceLarge family roomNewer windowsNew furnace
- 10 hours
- 55
- 2
Listed by:
Property Owner (734) 552-0719
Facts & features
Interior
Bedrooms & bathrooms
- Bedrooms: 4
- Bathrooms: 2
- Full bathrooms: 1
- 1/2 bathrooms: 1
Heating
- Forced air, Gas, Wood / Pellet
Cooling
- Central
Appliances
- Included: Dishwasher, Dryer, Garbage disposal, Range / Oven, Refrigerator, Washer
Features
- Flooring: Tile, Carpet, Hardwood
- Basement: Finished
- Has fireplace: Yes
Interior area
- Total interior livable area: 1,635 sqft
Property
Parking
- Total spaces: 2
- Parking features: Garage - Attached
Features
- Exterior features: Shingle, Vinyl, Brick
Lot
- Size: 7,535 Square Feet
Details
- Parcel number: 58131030190000
Construction
Type & style
- Home type: SingleFamily
Materials
- Roof: Asphalt
Condition
- New construction: No
- Year built: 1977
Community & HOA
Location
- Region: Flat Rock
Financial & listing details
- Price per square foot: $202/sqft
- Tax assessed value: $141,400
- Date on market: 10/19/2026
Estimated market value
$294,747
$274,000 - $315,000
$1,857/mo
Price history
| Date | Event | Price |
|---|---|---|
| 10/19/2026 | Listed for sale | $329,900$202/sqft |
Source: Owner Report a problem | ||
Public tax history
| Year | Property taxes | Tax assessment |
|---|---|---|
| 2025 | -- | $141,400 +13.5% |
| 2024 | -- | $124,600 +11.6% |
| 2023 | -- | $111,600 -2.7% |
| 2022 | -- | $114,700 +25.8% |
| 2021 | -- | $91,200 |
| 2020 | $3,889 +7.4% | $91,200 +16.3% |
| 2019 | $3,619 | $78,400 +0.4% |
| 2018 | $3,619 | $78,100 +1.8% |
| 2017 | -- | $76,700 +5.1% |
| 2016 | $2,451 | $73,000 +2% |
| 2015 | $2,451 -61.7% | $71,600 +11.2% |
| 2013 | $6,400 +161.1% | $64,400 +3% |
| 2012 | $2,451 | $62,500 -9.7% |
| 2010 | -- | $69,200 -12.8% |
| 2009 | -- | $79,400 -15.4% |
| 2008 | -- | $93,900 -4.1% |
| 2007 | -- | $97,900 |
| 2005 | $2,036 +15% | $97,900 +13.6% |
| 2002 | $1,770 | $86,200 +49.7% |
| 2001 | -- | $57,593 +3.2% |
| 2000 | $2,326 | $55,808 |
Find assessor info on the county website
Monthly payment
Est. payment
Payment breakdown
Explore the cost of this home by adjusting the details. Changes won't be saved.Climate risks
Neighborhood: 48134
Similar homes
- $260,0004 bd2 ba1.2k sqft23359 Port St, Flat Rock, MI 48134For Sale
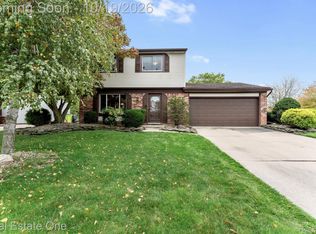
 MLS ID #20261084402, Patricia Fritz-Saenz, Real Estate One-Southgate. Realcomp II
- $344,9003 bd2 ba1.3k sqft28441 Cooke St, Flat Rock, MI 48134For Sale
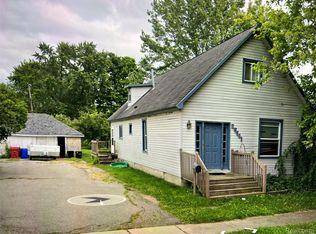 MLS ID #20261084464, Frank A Mastroianni, Real Estate One-Northville. Realcomp II
- $--4 bd3 ba2.2k sqft30171 Olmstead Rd, Flat Rock, MI 48134Auction
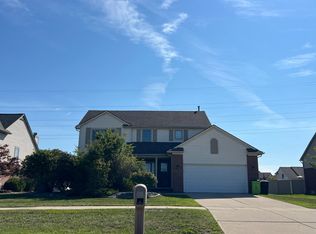 Auction.com 2
- $309,9004 bd2 ba2k sqft25991 E Huron River Dr, Flat Rock, MI 48134For Sale
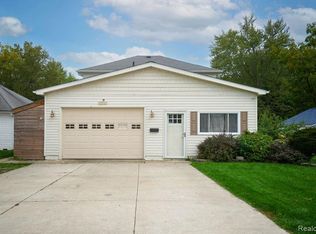 MLS ID #20261079758, Cara Pimer, Source Realty LLC. Realcomp II
- $295,0005 bd3 ba2.2k sqft25969 E Huron River Dr, Flat Rock, MI 48134For Sale
 MLS ID #26054185, Brian Traxler, Keller Williams Professionals. MichRIC
- $275,0004 bd3 ba2.2k sqft22101 Sylvan Ave, Flat Rock, MI 48134For SaleMLS ID #20261084241, Mark Lizyness, Real Estate One-Trenton. Realcomp II
- $210,0003 bd1 ba979 sqft29345 Sheeks Blvd S, Flat Rock, MI 48134For SaleMLS ID #20261084560, Daniel Beirne, OpenDoor Brokerage LLC. Realcomp II
- $254,9004 bd3 ba2.2k sqft29386 Walnut St, Flat Rock, MI 48134For Sale
 MLS ID #50223540, Thomas Hines, RE/MAX Masters, INC.. MiRealSource
- $355,0004 bd3 ba1.7k sqft20762 Richard Ave, Brownstown, MI 48183For SaleMLS ID #20261081697, Kaylyn Crayne, Home Direct Realty. Realcomp II
- $315,0003 bd2 ba1.8k sqft25177 Alicia St, Brownstown, MI 48134For SaleMLS ID #20261074060, Monica Hillman, RE/MAX Moves. Realcomp II
- $249,9003 bd2 ba1.2k sqft29405 Van Riper St, Flat Rock, MI 48134For SaleMLS ID #50223656, Andi Margrey, Century 21 Allstar Real Estate Team, Inc. MiRealSource
- $350,0003 bd3 ba2.2k sqft23212 Huron River Dr, Rockwood, MI 48173For SaleMLS ID #20261067827, Brian McCalister, Four Seasons Realty Dan Berry Group. Realcomp II
- $229,9003 bd1 ba1k sqft29715 Walnut St, Flat Rock, MI 48134For SaleMLS ID #20261082980, Mary Stockert, Berkshire Hathaway HomeServices Kee Realty Browns. Realcomp II
- $245,0003 bd1 ba1.7k sqft27081 Larkin Dr, Brownstown, MI 48183For SaleMLS ID #20261083388, Anthony Djon, Anthony Djon Luxury Real Estate. Realcomp II
- $298,0003 bd3 ba1.3k sqft22516 Devonshire St, Woodhaven, MI 48183For SaleMLS ID #26054542, Jeffrey Symons, Grapevine RealEstate Group LLC. MichRIC
- $275,0003 bd2 ba1.2k sqft24612 Middlebelt Rd, New Boston, MI 48164For SaleMLS ID #50225035, Kelly S Kaczor, Premiere Realty Group, LLC. MiRealSource
