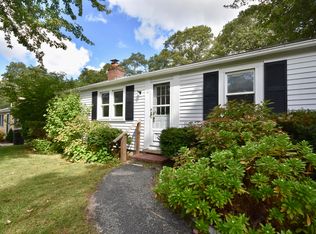
Move right into this charming 2-bedroom, 1-bath home in West Yarmouth! Offering over 850 square feet of living space, this well-built home features recent updates including a new heating and A/C system, updated trim and doors, a new stove, recessed lighting, a new bulkhead, bathroom improvements, and fresh interior paint. A full dry basement with generous headroom provides excellent storage and potential for additional usable space. Enjoy a fenced, low-maintenance yard and a convenient location within a few miles of Nantucket Sound beaches, golf, restaurants, and shopping. Currently the lowest priced single family home in Yarmouth. A great opportunity to own your own piece of Cape Cod! Owner reserves the right to sell the home prior to open house.
Pending
$425,000
315 Winslow Gray Road, West Yarmouth, MA 02673
2beds
864sqft
Single Family Residence
Built in 1987
4,791 Square Feet Lot
$423,100 Zestimate®
$492/sqft
$-- HOA
What's special
- 37 days
- 234
- 10
Zillow last checked:
Listing updated:
Listed by:
Leo Doyle 508-280-7951,
Oceanside Realty Group
Source: CCIMLS,MLS#: 22605186
Facts & features
Interior
Bedrooms & bathrooms
- Bedrooms: 2
- Bathrooms: 1
- Full bathrooms: 1
Appliances
- Included: Electric Range, Refrigerator, Washer, Electric, Water Heater
- Laundry: Electric Dryer
Features
- Flooring: Vinyl, Tile
- Basement: Full
Interior area
- Total structure area: 864
- Total interior livable area: 864 sqft
Property
Parking
- Total spaces: 3
- Parking features: Off Street, Paved
Features
- Stories: 1
Lot
- Size: 4,791 Square Feet
- Features: Fenced/Enclosed, Level
Details
- Parcel number: YARM M:49 B:94 L:
- Special conditions: Broker-Agent/Owner
Construction
Type & style
- Home type: SingleFamily
- Property subtype: Single Family Residence
Materials
- Vinyl Siding
- Roof: Asphalt
Condition
- Year built: 1987
Utilities & green energy
- Water: Public
Community & HOA
Location
- Region: West Yarmouth
Financial & listing details
- Price per square foot: $492/sqft
- Tax assessed value: $373,800
- Annual tax amount: $2,605
- Date on market: 10/10/2026
- Cumulative days on market: 36 days
Estimated market value
$423,100
$402,000 - $444,000
$2,696/mo
Price history
| Date | Event | Price |
|---|---|---|
| 10/19/2026 | Pending sale | $425,000$492/sqft |
Source:  CCIMLS #22605186 Report a problem | ||
| 10/19/2026 | Contingent | $425,000$492/sqft |
Source: MLS PIN #73590066 Report a problem | ||
| 10/12/2026 | Listed for sale | $425,000+45.5%$492/sqft |
Source: CCIMLS #22605186 Report a problem | ||
| 7/16/2026 | Sold | $292,000+34.9%$338/sqft |
Source: Public Record Report a problem | ||
| 10/30/2003 | Sold | $216,500+73.2%$251/sqft |
Source: Public Record Report a problem | ||
| 2/5/2002 | Sold | $125,000+73.6%$145/sqft |
Source: Public Record Report a problem | ||
| 10/11/1995 | Sold | $72,000+2.9%$83/sqft |
Source: Public Record Report a problem | ||
| 10/18/1994 | Sold | $70,000$81/sqft |
Source: Public Record Report a problem | ||
Public tax history
| Year | Property taxes | Tax assessment |
|---|---|---|
| 2025 | $2,406 -0.1% | $339,900 +4.1% |
| 2024 | $2,409 +2.2% | $326,400 +12.4% |
| 2023 | $2,356 +13% | $290,500 +33.2% |
| 2022 | $2,085 | $218,100 |
| 2021 | $2,085 -1.3% | $218,100 +3.2% |
| 2020 | $2,113 +8.1% | $211,300 +9.2% |
| 2019 | $1,954 +7.2% | $193,500 +9.3% |
| 2018 | $1,822 +2.6% | $177,100 |
| 2017 | $1,775 +4.2% | $177,100 +3.8% |
| 2016 | $1,703 +7% | $170,600 +7.6% |
| 2015 | $1,592 +2.8% | $158,600 +4.3% |
| 2014 | $1,549 +2.2% | $152,000 -0.8% |
| 2013 | $1,515 -6.7% | $153,300 -11.9% |
| 2012 | $1,624 +6.2% | $174,100 -1.6% |
| 2011 | $1,529 +7.1% | $177,000 -4.3% |
| 2010 | $1,428 +5.5% | $185,000 -8% |
| 2009 | $1,353 +2.4% | $201,100 -5.2% |
| 2008 | $1,321 +0.5% | $212,100 -5% |
| 2007 | $1,315 +8.6% | $223,200 +9.3% |
| 2006 | $1,211 +3.8% | $204,300 +19.8% |
| 2005 | $1,167 -38.3% | $170,600 |
| 2004 | $1,890 | $170,600 |
| 2003 | $1,890 +95.2% | $170,600 +89.6% |
| 2001 | $968 | $90,000 |
Find assessor info on the county website
Monthly payment
Est. payment
Payment breakdown
Explore the cost of this home by adjusting the details. Changes won't be saved.Climate risks
Neighborhood: West Yarmouth
- $454,6003 bd2 ba1.1k sqft6 Lake Rd E, West Yarmouth, MA 02673Off Market
- $532,4003 bd1 ba1.2k sqft321 Winslow Gray Rd, West Yarmouth, MA 02673Off Market
- $536,6004 bd2 ba1.2k sqft316-318 Winslow Gray Rd, West Yarmouth, MA 02673Off Market
- $614,5004 bd2 ba1.2k sqft312-314 Winslow Gray Rd, West Yarmouth, MA 02673Off Market
Similar homes
- $414,0002 bd1 ba680 sqft12 Lake Road E, West Yarmouth, MA 02673For Sale
 MLS ID #22604687, Tara Bazarewsky, Jack Conway. CCIMLS
- $450,0002 bd1 ba768 sqft49 Swan Lake Rd, West Yarmouth, MA 02673For Sale
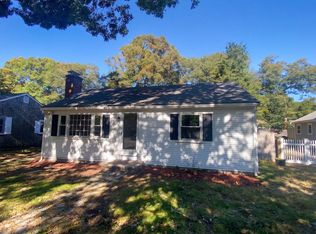 MLS ID #73592204, Daniel Beirne, OpenDoor Brokerage LLC. MLS PIN
- $425,0003 bd2 ba1k sqft47 Acres Avenue, West Yarmouth, MA 02673For Sale
 MLS ID #22603718, Michele L Billingsley, LPT Realty. CCIMLS
- $--2 bd1 ba816 sqft10 Shallow Brook Rd, South Yarmouth, MA 02664Auction
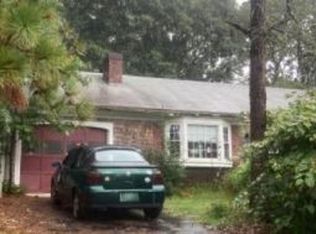 Xome
- $535,0002 bd1 ba974 sqft142 Winslow Gray Road, West Yarmouth, MA 02673For SaleMLS ID #22605099, Michelle Chaisson-Turmelle, Today Real Estate. CCIMLS
- $584,9003 bd2 ba1.1k sqft20 Harding Lane, West Yarmouth, MA 02673For SaleMLS ID #22605259, Daniel J Michael, Main Street Realty. CCIMLS
- $515,0002 bd1 ba888 sqft50 Shallow Brook Road, South Yarmouth, MA 02664For SaleMLS ID #22605359, Ned B Chatelain, Chatelain Real Estate. CCIMLS
- $449,0002 bd2 ba677 sqft15 Alden Way, Hyannis, MA 02601For SaleMLS ID #22605710, Sofiya Bailey, Coastal Point Properties, LLC. CCIMLS
- $369,9002 bd2 ba1k sqft222 Buck Island Road #6-2, West Yarmouth, MA 02673For SaleMLS ID #22604967, Team Seaport, Seaport Village Realty. CCIMLS
- $399,8002 bd2 ba1.2k sqft481 Buck Island Road UNIT 12EA, West Yarmouth, MA 02673For SaleMLS ID #22605301, Adrienne G Siegel, Strawberry Hill R E. CCIMLS
- $439,0002 bd1 ba561 sqft36 Alden Way, Hyannis, MA 02601For SaleMLS ID #22605692, Sofia T Naoom, Coastal Point Properties, LLC. CCIMLS
- $465,0002 bd2 ba1k sqft441 BUCK ISLAND Road #B2, West Yarmouth, MA 02673For SaleMLS ID #22605526, Mike Karras, William Raveis Real Estate & Home Services. CCIMLS
- $549,0002 bd2 ba1.2k sqft38 McNamara Avenue, West Yarmouth, MA 02673For SaleMLS ID #22603866, Christa Zevitas, Berkshire Hathaway HomeServices Robert Paul Properties. CCIMLS
- $479,9002 bd1 ba480 sqft62 Breezy Point Road, South Yarmouth, MA 02664For SaleMLS ID #22605584, Natalie Avci, Griffin Realty Group. CCIMLS
- $549,0003 bd2 ba1.1k sqft32 Scholl Avenue, West Yarmouth, MA 02673For SaleMLS ID #22605219, Alan Horvitz, LAER Realty Partners. CCIMLS
- $385,0002 bd2 ba1.1k sqft248 Camp Street APT D1, West Yarmouth, MA 02673For SaleMLS ID #22605534, Jill Guidi, Kinlin Grover Compass. CCIMLS
- $609,0004 bd1 ba1.1k sqft2 Constance Avenue E, West Yarmouth, MA 02673For SaleMLS ID #22605518, Louis Guerrier, Seaport Village Realty. CCIMLS
