This 1984 square foot single family home has 3 bedrooms and 3.0 bathrooms. This home is located at 343 Osborne Ct, Ripon, CA 95366.
Pre-foreclosure
Est. $700,500
343 Osborne Ct, Ripon, CA 95366
3beds
1,984sqft
SingleFamily
Built in 1998
8,833 Square Feet Lot
$700,500 Zestimate®
$353/sqft
$-- HOA
Overview
- 56 days
- 18
- 1
Facts & features
Interior
Bedrooms & bathrooms
- Bedrooms: 3
- Bathrooms: 3
- Full bathrooms: 2
- 1/2 bathrooms: 1
Heating
- Other
Cooling
- Central
Features
- Flooring: Tile, Carpet
- Has fireplace: Yes
Interior area
- Total interior livable area: 1,984 sqft
Property
Parking
- Total spaces: 3
Features
- Exterior features: Stucco, Wood
- Has spa: Yes
Lot
- Size: 8,833 Square Feet
Details
- Parcel number: 261440220000
Construction
Type & style
- Home type: SingleFamily
Materials
- wood frame
- Roof: Tile
Condition
- Year built: 1998
Utilities & green energy
- Sewer: In & Connected
- Utilities for property: All Public
Community & HOA
Location
- Region: Ripon
Financial & listing details
- Price per square foot: $353/sqft
- Tax assessed value: $539,666
Foreclosure details
Estimated market value
$700,500
$665,000 - $736,000
$3,427/mo
Price history
| Date | Event | Price |
|---|---|---|
| 6/15/2018 | Sold | $465,000$234/sqft |
Source: Agent Provided Report a problem | ||
| 5/14/2018 | Pending sale | $465,000$234/sqft |
Source: Roland Group Real Estate #18018966 Report a problem | ||
| 3/30/2018 | Listed for sale | $465,000+146.7%$234/sqft |
Source: Roland Group Real Estate #18018966 Report a problem | ||
| 8/21/1998 | Sold | $188,500$95/sqft |
Source: Public Record Report a problem | ||
Public tax history
| Year | Property taxes | Tax assessment |
|---|---|---|
| 2026 | -- | $539,666 +2% |
| 2025 | $5,790 +1.7% | $529,085 +2% |
| 2024 | $5,696 +2.1% | $518,712 +2% |
| 2023 | $5,580 +1.6% | $508,542 +2% |
| 2022 | $5,492 +1.6% | $498,572 +2% |
| 2021 | $5,408 +0.9% | $488,797 +1% |
| 2020 | $5,359 +1.7% | $483,786 +2% |
| 2019 | $5,267 +63.5% | $474,300 +64.3% |
| 2018 | $3,221 +2% | $288,762 +2% |
| 2017 | $3,159 +1.7% | $283,101 +2% |
| 2016 | $3,106 +4% | $277,551 +1.5% |
| 2015 | $2,988 | $273,384 +2% |
| 2014 | $2,988 | $268,028 +0.5% |
| 2013 | -- | $266,818 +2% |
| 2012 | -- | $261,587 +2% |
| 2011 | -- | $256,459 +0.8% |
| 2010 | -- | $254,544 -0.2% |
| 2009 | -- | $255,150 +2% |
| 2008 | -- | $250,147 +2% |
| 2007 | -- | $245,241 +2% |
| 2006 | -- | $240,433 +2% |
| 2005 | -- | $235,720 +2% |
| 2004 | -- | $231,098 +1.9% |
| 2003 | -- | $226,864 +14.1% |
| 2002 | -- | $198,834 |
| 2001 | -- | $198,834 |
Find assessor info on the county website
Monthly payment
Climate risks
Neighborhood: 95366
Similar homes
- $699,0004 bd3 ba2.4k sqft966 Shelly Ct, Ripon, CA 95366For Sale
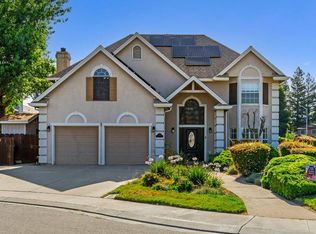 MLS ID #226110691, Patrice Hoffman. MetroList Services of CA
- $665,0003 bd2 ba1.7k sqft247 Oregon St, Ripon, CA 95366For Sale
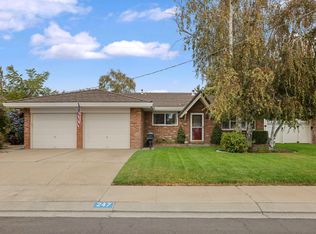 MLS ID #226130899, Lori Bunnell. MetroList Services of CA
- $680,0003 bd3 ba1.7k sqft23276 Cypress Point Dr, Ripon, CA 95366For Sale
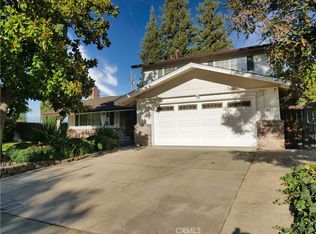 MLS ID #SC26199554, Kyle Reis, Coastal Connection Real Estate. CRMLS
- $800,0005 bd3 ba2.7k sqft1530 Calhoun Ave, Ripon, CA 95366For Sale
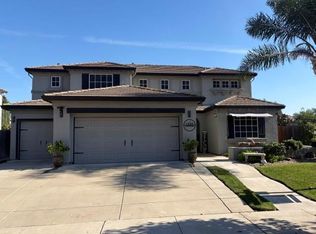 MLS ID #226135380, Matthew Enriquez. MetroList Services of CA
