Beautiful Spacious Corner Lot home located in Marion Oaks. Large Backyard for parties and family gatherings. Property being sold AS IS. Deed Restricted Community
For sale
$250,000
348 Marion Oaks Golf Rd, Ocala, FL 34473
3beds
1,770sqft
Single Family Residence
Built in 2005
-- sqft lot
$246,500 Zestimate®
$141/sqft
$-- HOA
What's special
Corner lot
- 8 days
- 782
- 28
Likely to sell faster than
Zillow last checked:
Listing updated:
Listed by:
Stephanne Brown 786-439-9740,
Beachfront Realty Inc
Source: MIAMI,MLS#: A12119955 Originating MLS: A-Miami Association of REALTORS
Facts & features
Interior
Bedrooms & bathrooms
- Bedrooms: 3
- Bathrooms: 2
- Full bathrooms: 2
Rooms
- Room types: Den/Library/Office
Heating
- Central
Cooling
- Central Air
Appliances
- Included: Dryer, Electric Range, Electric Water Heater, Refrigerator, Washer
- Laundry: Laundry Room
Features
- Walk-In Closet(s)
- Flooring: Carpet, Tile, Wood
Interior area
- Total interior livable area: 1,770 sqft
Property
Parking
- Total spaces: 2
- Parking features: Driveway
- Attached garage spaces: 2
- Has uncovered spaces: Yes
Features
- Stories: 1
- Entry location: First Floor Entry
- Patio & porch: Open Porch, Patio
- Pool features: R30-No Pool/No Water
- Fencing: Fenced
- View description: None
Lot
- Features: Less Than 1/4 Acre Lot
Details
- Parcel number: 8005076410
- Zoning: R1
Construction
Type & style
- Home type: SingleFamily
- Property subtype: Single Family Residence
Materials
- Concrete Block Construction, Stucco
- Roof: Fiberglass,Shingle
Condition
- Year built: 2005
Utilities & green energy
- Sewer: Septic Tank
- Water: Municipal Water
Community & HOA
Community
- Features: None, No Subdiv/Park Info
- Subdivision: Marion Oaks
HOA
- Has HOA: No
Location
- Region: Ocala
Financial & listing details
- Price per square foot: $141/sqft
- Tax assessed value: $220,727
- Annual tax amount: $1,000
- Date on market: 11/7/2026
- Listing terms: All Cash,Conventional,FHA,VA Loan
Estimated market value
$246,500
$234,000 - $259,000
$1,873/mo
Price history
| Date | Event | Price |
|---|---|---|
| 11/8/2026 | Listed for sale | $250,000+55.1%$141/sqft |
Source:  MIAMI #A12119955 Report a problem | ||
| 12/15/2005 | Sold | $161,200+5848.3%$91/sqft |
Source: Public Record Report a problem | ||
| 4/28/2000 | Sold | $2,710$2/sqft |
Source: Public Record Report a problem | ||
Public tax history
| Year | Property taxes | Tax assessment |
|---|---|---|
| 2025 | $4,027 +9.9% | $200,270 +10% |
| 2024 | $3,666 +3.5% | $182,064 +10% |
| 2023 | $3,543 +6.9% | $165,513 +10% |
| 2022 | $3,314 +19.8% | $150,466 +10% |
| 2021 | $2,766 +2.3% | $136,787 +3.4% |
| 2020 | $2,704 +3.7% | $132,292 +7.6% |
| 2019 | $2,607 | $122,912 -0.7% |
| 2018 | $2,607 +21.7% | $123,797 +18.3% |
| 2017 | $2,142 +13.4% | $104,673 +13.3% |
| 2016 | $1,888 | $92,345 +10% |
| 2015 | $1,888 +15.4% | $83,950 +10% |
| 2014 | $1,637 +5.1% | $76,318 +5.3% |
| 2013 | $1,557 +1.6% | $72,460 +1.7% |
| 2012 | $1,533 -3.3% | $71,256 -4.4% |
| 2011 | $1,585 -26.5% | $74,538 -31.3% |
| 2010 | $2,155 -19% | $108,571 -24% |
| 2009 | $2,660 -7.3% | $142,941 -10% |
| 2008 | $2,871 +2.1% | $158,804 +2.6% |
| 2007 | $2,812 +5.9% | $154,728 +21.8% |
| 2006 | $2,654 +2327% | $127,044 +1170.4% |
| 2005 | $109 | $10,000 +185.7% |
| 2004 | $109 -21.5% | $3,500 |
| 2002 | $139 +16.5% | $3,500 |
| 2001 | $120 | $3,500 |
| 2000 | $120 | $3,500 |
Find assessor info on the county website
Monthly payment
Est. payment
Payment breakdown
Explore the cost of this home by adjusting the details. Changes won't be saved.Climate risks
Neighborhood: 34473


Similar homes
- $255,0003 bd2 ba1.6k sqft3399 SW 153RD LANE, OCALA, FL 34473For Sale

 MLS ID #OM734979, Ivette Garcia, MARION OAKS REALTY & PROPERTY. Stellar MLS
- $209,9003 bd2 ba1k sqft14514 SW 45TH CIRCLE, OCALA, FL 34473For Sale
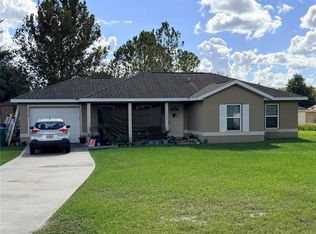 MLS ID #S5161073, TJ Connor, PREMIUM PROPERTIES R.E SERVICE. Stellar MLS
- $250,0003 bd2 ba2k sqft818 MARION OAKS MANOR, OCALA, FL 34473For Sale
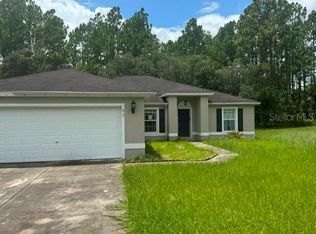 MLS ID #G5115597, Paul Lemieux II, PA, KELLER WILLIAMS CORNERSTONE RE. Stellar MLS
- $224,9003 bd2 ba1.4k sqft3702 SW 148TH PLACE, OCALA, FL 34473For Sale
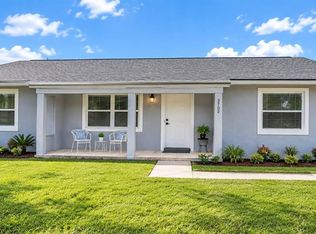 MLS ID #OM734630, Rosario Cornman, LPT REALTY, LLC. Stellar MLS
- $260,0003 bd2 ba1.3k sqft3742 SW 134TH STREET, OCALA, FL 34473For SaleMLS ID #OM731354, Chad MacBlain, KELLER WILLIAMS CORNERSTONE RE. Stellar MLS
- $265,0004 bd2 ba1.8k sqft5325 SW 129TH PLACE, OCALA, FL 34473For SaleMLS ID #G5117584, Robin Lis, DOWN HOME REALTY, LLLP. Stellar MLS
- $254,9003 bd2 ba1.6k sqft8121 SW 128TH LOOP, OCALA, FL 34473For SaleMLS ID #OM721340, Carlos Gonzalez, CENTURY 21 AFFILIATES. Stellar MLS
- $190,0003 bd2 ba1.7k sqft416 MARION OAKS LANE, OCALA, FL 34473For SaleMLS ID #OM732165, Amber Nardino, EXP REALTY LLC. Stellar MLS
- $206,0003 bd2 ba1.3k sqft2494 SW 170TH LOOP, OCALA, FL 34473For SaleMLS ID #OM725690, Daniel Robertson, GREATER OCALA PROPERTIES, INC. Stellar MLS
- $230,0004 bd2 ba1.6k sqft8525 SW 136TH LOOP, OCALA, FL 34473For SaleMLS ID #OM714422, lyn Wedderburn, THE KEYES COMPANY. Stellar MLS
- $339,9003 bd2 ba2.1k sqft8504 SW 133RD LANE ROAD, OCALA, FL 34473For SaleMLS ID #R4912289, Isabella Uran, OLLEB PROPERTIES, LLC. Stellar MLS
- $250,0003 bd2 ba1.7k sqft8549 SW 136TH TERRACE, DUNNELLON, FL 34432For SaleMLS ID #O6436981, Mary Reed, FIRST LADY REALTY AND INVESTMENTS LLC. Stellar MLS
- $240,0002 bd2 ba1.6k sqft11492 SW 82ND COURT ROAD, OCALA, FL 34481For SaleMLS ID #OM732214, Mercy Reyes-Rubin, RE/MAX FOXFIRE - HWY200/103 S. Stellar MLS
- $325,0003 bd2 ba1.4k sqft484 MARION OAKS LANE, OCALA, FL 34473For SaleMLS ID #O6417916, Candace Garber, TRUDEALS REALTY CORP. Stellar MLS
- $239,0003 bd2 ba1.3k sqft14232 SE 34TH TERRACE, SUMMERFIELD, FL 34491For SaleMLS ID #OM734332, Donna Hines, RE/MAX PREMIER REALTY LADY LK. Stellar MLS
- $259,9994 bd3 ba1.6k sqft61 PINE TRACE RUN, OCALA, FL 34472For SaleMLS ID #S5158703, Rey Andrade, THE PROPERTY PROS REAL ESTATE, INC. Stellar MLS
- $285,0003 bd2 ba1.7k sqft323 SE 37TH AVENUE, OCALA, FL 34471For SaleMLS ID #OM735027, Todd Fambrough, STRATEGIC REALTY. Stellar MLS
