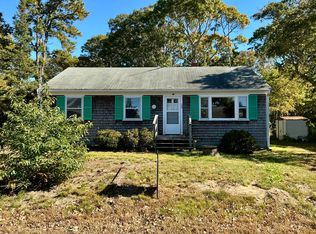
Classic Cape on a quiet cul-de-sac in the village of Fells Pond within New Seabury. A short stroll to association access to Fells Pond for swimming, fishing, and small watercraft. Remodeled eat-in kitchen open to fireplaces family room, all wood floors. First floor bedroom and den/office. Two large front to back second floor bedrooms and bath on the second floor. Detailed interior woodwork, built-ins, and a finished lower level.
For sale
$999,000
35 Marway, Mashpee, MA 02649
3beds
2,055sqft
Single Family Residence
Built in 1981
0.37 Acres Lot
$957,600 Zestimate®
$486/sqft
$73/mo HOA
What's special
Quiet cul-de-sacRemodeled eat-in kitchenFirst floor bedroomFinished lower levelAll wood floorsDetailed interior woodworkFireplaces family room
- 22 days
- 1,472
- 70
Zillow last checked:
Listing updated:
Listed by:
Bruce M Maikath 508-451-7452,
Seagrass Realty
Source: CCIMLS,MLS#: 22605477
Facts & features
Interior
Bedrooms & bathrooms
- Bedrooms: 3
- Bathrooms: 2
- Full bathrooms: 2
Heating
- Natural Gas
Cooling
- Central Air
Appliances
- Included: Countertop Range, Dishwasher, Refrigerator, Wall/Oven Cook Top, Washer, Natural Gas, Water Heater
Features
- Linen Closet
- Flooring: Vinyl, Wood, Tile, Carpet
- Basement: Finished,Full
- Number of fireplaces: 1
Interior area
- Total structure area: 2,055
- Total interior livable area: 2,055 sqft
Property
Parking
- Parking features: Driveway, Off Street, Gravel
- Has uncovered spaces: Yes
Features
- Stories: 2
- Patio & porch: Deck
Lot
- Size: 0.37 Acres
- Features: Level
Details
- Parcel number: MASH M:116 B: L:40
- Special conditions: None
Construction
Type & style
- Home type: SingleFamily
- Property subtype: Single Family Residence
Materials
- Shingle Siding
- Roof: Asphalt,Pitched
Condition
- Year built: 1981
Utilities & green energy
- Water: Public
Community & HOA
Community
- Subdivision: Fells Pond
HOA
- Has HOA: Yes
- Amenities included: Beach Access, Road Maintenance
- Services included: Common Area
- HOA fee: $875 annually
Location
- Region: Mashpee
Financial & listing details
- Price per square foot: $486/sqft
- Tax assessed value: $808,500
- Annual tax amount: $5,387
- Date on market: 10/29/2026
- Cumulative days on market: 23 days
Estimated market value
$957,600
$910,000 - $1.01M
$3,628/mo
Price history
| Date | Event | Price |
|---|---|---|
| 10/29/2026 | Listed for sale | $999,000$486/sqft |
Source:  CCIMLS #22605477 Report a problem | ||
Public tax history
| Year | Property taxes | Tax assessment |
|---|---|---|
| 2025 | $5,055 +9.7% | $763,600 +6.5% |
| 2024 | $4,608 +8.9% | $716,700 +18.8% |
| 2023 | $4,231 +5.3% | $603,500 +22.7% |
| 2022 | $4,019 +2.2% | $491,900 +13.4% |
| 2021 | $3,933 -1.1% | $433,600 -0.8% |
| 2020 | $3,975 +4.1% | $437,300 +3.7% |
| 2019 | $3,818 +2.5% | $421,900 +1.1% |
| 2018 | $3,724 +1.4% | $417,500 +4.5% |
| 2017 | $3,671 +2.6% | $399,500 +3.2% |
| 2016 | $3,578 +3.8% | $387,200 +2.3% |
| 2015 | $3,447 -2% | $378,400 +1% |
| 2014 | $3,518 -3.7% | $374,700 -4.8% |
| 2013 | $3,654 +3.6% | $393,700 |
| 2012 | $3,528 -5.1% | $393,700 -6.5% |
| 2011 | $3,717 +3.8% | $421,000 -8.4% |
| 2010 | $3,580 +11.3% | $459,500 -0.2% |
| 2009 | $3,217 +13.4% | $460,300 +6.7% |
| 2008 | $2,838 +4.1% | $431,300 -7.6% |
| 2007 | $2,726 -4.1% | $466,800 +9.6% |
| 2006 | $2,844 +10.7% | $425,800 +7.6% |
| 2005 | $2,568 -3.5% | $395,700 +44.8% |
| 2004 | $2,661 +2.4% | $273,200 |
| 2003 | $2,598 +6.9% | $273,200 |
| 2002 | $2,431 +5.6% | $273,200 +61.1% |
| 2001 | $2,303 | $169,600 |
Find assessor info on the county website
Monthly payment
Est. payment
Payment breakdown
Explore the cost of this home by adjusting the details. Changes won't be saved.Climate risks
Neighborhood: 02649


Similar homes
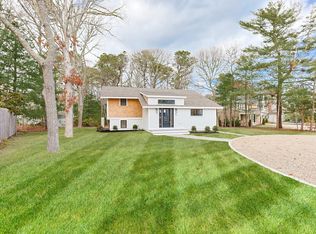
- $954,0003 bd3 ba2.3k sqft44 Summersea Road, Mashpee, MA 02649For Sale
 MLS ID #22605149, Marian Oost-Lievense, New Seabury Sotheby's International Realty. CCIMLS
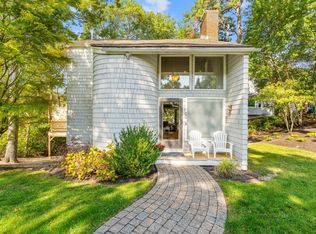
- $895,0003 bd2 ba2.2k sqft10 Oxfordshire Place, Mashpee, MA 02649For Sale
 MLS ID #22604936, Carli Taylor, Kinlin Grover Compass. CCIMLS
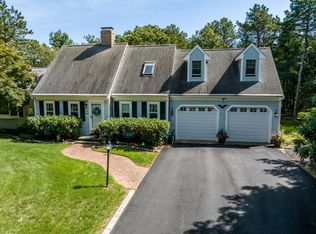
- $1,275,0003 bd3 ba2.4k sqft14 Bayshore Drive, Mashpee, MA 02649For Sale
 MLS ID #22605286, Ann Lynch, Kinlin Grover Compass. CCIMLS
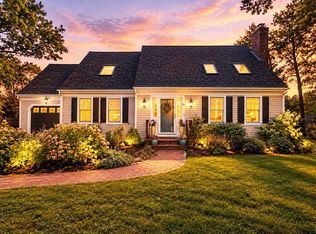
- $849,0003 bd1 ba1k sqft39 Bayview Road, Mashpee, MA 02649For Sale
 MLS ID #22605422, Priscilla A Stolba, Priscilla Stolba R E. CCIMLS
- $1,069,0002 bd2 ba1.7k sqft75 Sipps Road UNIT 75, Mashpee, MA 02649For SaleMLS ID #22603170, Michael J Degnan, Christie's Int'l RE Atlantic Brokerage. CCIMLS
- $695,0002 bd2 ba1.7k sqft262 Meetinghouse Road, Mashpee, MA 02649For SaleMLS ID #22605664, Matt J Chernow, Greer Real Estate, LLC. CCIMLS
- $1,199,9002 bd2 ba1.2k sqft5 Bayview Road, Mashpee, MA 02649For SaleMLS ID #22604939, Sharon Lamoureux, Today Real Estate. CCIMLS
- $1,299,9993 bd3 ba1.8k sqft5 Saltwater Circle, Mashpee, MA 02649For SaleMLS ID #22605028, Kenneth E Marsters, Prime Homes. CCIMLS
- $1,425,0003 bd3 ba2.7k sqft4 Brookside Circle, Mashpee, MA 02649For SaleMLS ID #22605523, Laurie - Ann Webster, Today Real Estate. CCIMLS
- $795,0003 bd3 ba2k sqft19 Maple Street, Mashpee, MA 02649For SaleMLS ID #22605127, Rory Eames, Coldwell Banker Martha Murray. CCIMLS
- $1,145,0004 bd4 ba1.8k sqft51 Horseshoe Bend Way, Mashpee, MA 02649For SaleMLS ID #22605593, Kathryn Kolka, Today Real Estate. CCIMLS
- $795,0003 bd2 ba1.3k sqft35 Pequot Road, Mashpee, MA 02649For SaleMLS ID #22604858, Brian G Cobb, CRS, Kinlin Grover Compass. CCIMLS
- $1,400,0002 bd2 ba1.1k sqft262 Monomoscoy Road, Mashpee, MA 02649For SaleMLS ID #22605340, Sandra R Colarusso, Radford Realty Group. CCIMLS
- $999,9004 bd1 ba2.4k sqft204 Waquoit Highway, East Falmouth, MA 02536For SaleMLS ID #22604371, Cape Cod Retirement Group, Kinlin Grover Compass. CCIMLS
- $549,9003 bd2 ba1.1k sqft45 Orchard Road, Mashpee, MA 02649For SaleMLS ID #22605668, Cait Graves, Today Real Estate. CCIMLS
- $774,9993 bd2 ba1.6k sqft84 Lakewood Drive, Mashpee, MA 02649For SaleMLS ID #22604907, Susan W Keleher, Kinlin Grover Compass. CCIMLS
- $549,9003 bd2 ba1.4k sqft9 Tri-Town Circle, Mashpee, MA 02649For SaleMLS ID #22605714, Dennis D Murphy, Weichert, Realtors-Donahue Partners. CCIMLS
- $999,9993 bd2 ba1.4k sqft276 Pheasant Hill Circle, Cotuit, MA 02635For SaleMLS ID #22604692, Amy L Delgado, Salt Pond Realty LLP. CCIMLS
- $699,0003 bd2 ba1.4k sqft20 Mutiny Way, Mashpee, MA 02649For SaleMLS ID #22505707, Amanda S Clark, Cape Cod Realty Advisors. CCIMLS
- $1,100,0003 bd2 ba2.2k sqft17 Cranberry Lane, East Falmouth, MA 02536For SaleMLS ID #22602545, Susan Challenger, Sotheby's International Realty. CCIMLS
