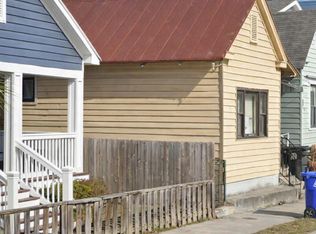
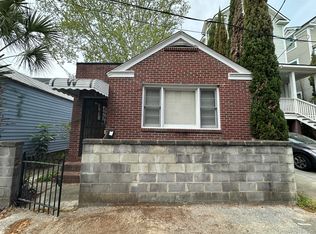
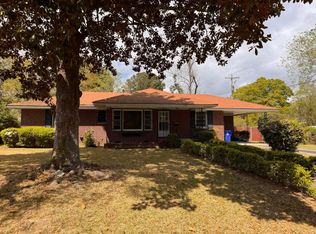
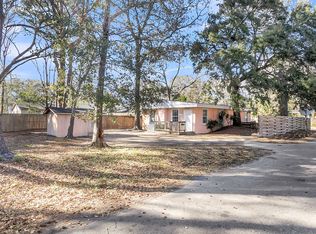
Welcome to beautiful downtown Charleston, close to the Nomo area. this property boasts of marsh and beautiful views of the Ravenel Bridge. Great potential for beautiful spacious home as primary residence or rental property. Close to E. Bay St., the battery, and historic downtown Charleston. This is an investor's dream or a primary homeowner's custom home. Build your dream home here. Property is being sold ''as is''.
Active contingent
Price cut: $25.1K (4/27)
$349,900
355 Nassau St, Charleston, SC 29403
3beds
1,539sqft
Single Family Residence
Built in 1900
3,484 Square Feet Lot
$-- Zestimate®
$227/sqft
$-- HOA
What's special
- 116 days |
- 1,571 |
- 47 |
Zillow last checked:
Listing updated:
Listed by:
EXP Realty LLC
Source: CTMLS,MLS#: 25005068
Facts & features
Interior
Bedrooms & bathrooms
- Bedrooms: 3
- Bathrooms: 2
- Full bathrooms: 2
Heating
- Baseboard
Features
- Flooring: Wood
- Has fireplace: No
Interior area
- Total structure area: 1,539
- Total interior livable area: 1,539 sqft
Video & virtual tour
Property
Parking
- Parking features: Off Street
Features
- Levels: One
- Stories: 1
- Patio & porch: Front Porch
Lot
- Size: 3,484 Square Feet
- Features: 0 - .5 Acre, Level
Details
- Parcel number: 4590101037
Construction
Type & style
- Home type: SingleFamily
- Architectural style: Traditional
- Property subtype: Single Family Residence
Materials
- Vinyl Siding
- Roof: Architectural
Condition
- New construction: No
- Year built: 1900
Utilities & green energy
- Sewer: Public Sewer
- Water: Public
- Utilities for property: Charleston Water Service, Dominion Energy
Community & HOA
Community
- Subdivision: None
Location
- Region: Charleston
Financial & listing details
- Price per square foot: $227/sqft
- Tax assessed value: $426,000
- Date on market: 3/9/2026
- Listing terms: Any
Estimated market value
Not available
Estimated sales range
Not available
$4,617/mo
Price history
| Date | Event | Price |
|---|---|---|
| 6/10/2026 | Contingent | $349,900$227/sqft |
Source: eXp Realty #25005068 Report a problem | ||
| 5/16/2026 | Listed for sale | $349,900$227/sqft |
Source: eXp Realty #25005068 Report a problem | ||
| 5/5/2026 | Contingent | $349,900$227/sqft |
Source: eXp Realty #25005068 Report a problem | ||
| 4/27/2026 | Price change | $349,900-6.7%$227/sqft |
Source: | ||
| 3/30/2026 | Price change | $375,000-19.7%$244/sqft |
Source: | ||
| 3/9/2026 | Listed for sale | $467,000$303/sqft |
Source: | ||
| 2/25/2026 | Listing removed | $467,000$303/sqft |
Source: | ||
| 10/21/2025 | Price change | $467,000-4.3%$303/sqft |
Source: | ||
| 9/4/2025 | Price change | $488,000-2.4%$317/sqft |
Source: | ||
| 7/23/2025 | Price change | $499,900-11.5%$325/sqft |
Source: | ||
| 4/24/2025 | Listed for sale | $565,000$367/sqft |
Source: | ||
| 4/2/2025 | Contingent | $565,000$367/sqft |
Source: | ||
| 2/27/2025 | Listed for sale | $565,000$367/sqft |
Source: | ||
Public tax history
| Year | Property taxes | Tax assessment |
|---|---|---|
| 2025 | -- | $8,510 +15% |
| 2024 | $2,249 +3.4% | $7,400 |
| 2023 | $2,176 +6% | $7,400 |
| 2022 | $2,053 +1.2% | $7,400 |
| 2021 | $2,029 +0.7% | $7,400 |
| 2020 | $2,014 | $7,400 +15.1% |
| 2019 | $2,014 | $6,430 |
| 2017 | $2,014 +23.1% | $6,430 |
| 2011 | $1,636 +23.1% | -- |
| 2010 | $1,329 -1.8% | $5,310 |
| 2009 | $1,354 +166% | $5,310 +50% |
| 2008 | $509 +9.4% | $3,540 |
| 2006 | $466 -1% | $3,540 |
| 2005 | $470 +21.8% | $3,540 +54.6% |
| 2004 | $386 -11% | $2,290 |
| 2003 | $434 +1.5% | $2,290 |
| 2002 | $428 +19.9% | $2,290 +46.8% |
| 2000 | $357 | $1,560 |
Find assessor info on the county website
Monthly payment
Est. payment$--/mo
Payment breakdown
Explore the cost of this home by adjusting the details. Changes won't be saved.All calculations are estimates and provided by Zillow, Inc. for informational purposes only. Actual amounts may vary.
HOA fees may include property taxes on listings classified as Co-Ops. Contact the listing agent and/or owner for fee details.
Mortgage interest rates are dependent on a number of factors, including credit score, down payment, and repayment length. Interest rate data provided by Zillow Group Marketplace, Inc. as of 1/1/1970 from various mortgage lenders with which we have lead or other similar arrangements; the Estimated Payment is an average of those rates.
See how much you could borrow to make a competitive offer.
Climate risks
Neighborhood: East Central
Nearby schools
GreatSchools rating
- 7/10Sanders-Clyde Elementary SchoolGrades: PK-5Distance: 0.4 mi
- 4/10Simmons Pinckney Middle SchoolGrades: 6-8Distance: 1 mi
- 1/10Burke High SchoolGrades: 9-12Distance: 1 mi
Schools provided by the listing agent
- Elementary: Sanders Clyde
- Middle: Simmons Pinckney
- High: Burke
Source: CTMLS. This data may not be complete. We recommend contacting the local school district to confirm school assignments for this home.

A local agent can set up tours, give advice and negotiate with sellers.

Nearby cities
Nearby neighborhoods
Nearby zip codes
Other Charleston Topics
