This home needs some TLC. The basement can be finished and could add another bedroom bath suite with large, enclosed laundry area and large family-game room. mechanicals are enclosed. This home has a lot of potential to be a great home.
For sale by owner
$155,000
3701 Spann Ave, Indianapolis, IN 46203
3beds
1baths
864sqft
SingleFamily
Built in 1946
5,314 Square Feet Lot
$105,600 Zestimate®
$179/sqft
$-- HOA
What's special
Mechanicals are enclosed
What the owner loves about this home
This home has a great basement lay out and size to add a lot more space. Nice neighborhood and yard with garage.
- 23 hours
- 71
- 7
Listed by:
Property Owner (317) 410-3577
Facts & features
Interior
Bedrooms & bathrooms
- Bedrooms: 3
- Bathrooms: 1
Heating
- Other
Cooling
- Central
Appliances
- Included: Refrigerator
Features
- Has fireplace: No
Interior area
- Total interior livable area: 864 sqft
Property
Parking
- Parking features: Garage - Detached
Lot
- Size: 5,314 Square Feet
Details
- Parcel number: 491008144092000101
Construction
Type & style
- Home type: SingleFamily
Materials
- Frame
- Roof: Asphalt
Condition
- New construction: No
- Year built: 1946
Community & HOA
Location
- Region: Indianapolis
Financial & listing details
- Price per square foot: $179/sqft
- Tax assessed value: $76,600
- Annual tax amount: $1,768
- Date on market: 11/20/2026
Estimated market value
$105,600
$83,000 - $130,000
$1,486/mo
Price history
| Date | Event | Price |
|---|---|---|
| 11/20/2026 | Listed for sale | $155,000+87.9%$179/sqft |
Source: Owner Report a problem | ||
| 10/10/2023 | Sold | $82,500-16.7%$95/sqft |
Source:  MIBOR as distributed by MLS GRID #21910389 Report a problem | ||
| 9/13/2023 | Pending sale | $99,000$115/sqft |
Source: MIBOR as distributed by MLS GRID #21910389 Report a problem | ||
| 8/9/2023 | Price change | $99,000-10%$115/sqft |
Source: MIBOR as distributed by MLS GRID #21910389 Report a problem | ||
| 8/3/2023 | Listed for sale | $110,000$127/sqft |
Source: MIBOR as distributed by MLS GRID #21910389 Report a problem | ||
| 7/5/2023 | Listing removed | -- |
Source: MIBOR as distributed by MLS GRID #21910389 Report a problem | ||
| 5/4/2023 | Listed for sale | $110,000$127/sqft |
Source: MIBOR as distributed by MLS GRID #21910389 Report a problem | ||
| 4/4/2023 | Pending sale | $110,000$127/sqft |
Source: MIBOR as distributed by MLS GRID #21910389 Report a problem | ||
| 3/14/2023 | Listed for sale | $110,000+144.4%$127/sqft |
Source: MIBOR as distributed by MLS GRID #21910389 Report a problem | ||
| 3/24/2020 | Listing removed | $850$1/sqft |
Source: Supreme Property Management Report a problem | ||
| 3/19/2020 | Price change | $850-5.6%$1/sqft |
Source: Supreme Property Management Report a problem | ||
| 11/14/2019 | Listed for rent | $900$1/sqft |
Source: Supreme Property Management Report a problem | ||
| 10/24/2019 | Sold | $45,000+11.1%$52/sqft |
Source: Public Record Report a problem | ||
| 8/6/2019 | Sold | $40,500+73.1%$47/sqft |
Source: Public Record Report a problem | ||
| 9/25/2009 | Sold | $23,400-6.4%$27/sqft |
Source: MIBOR as distributed by MLS GRID #2934796 Report a problem | ||
| 7/15/2009 | Listed for sale | $25,000-48.4%$29/sqft |
Source: foreclosure.com Report a problem | ||
| 5/24/2006 | Sold | $48,450$56/sqft |
Source: Public Record Report a problem | ||
Public tax history
| Year | Property taxes | Tax assessment |
|---|---|---|
| 2025 | $1,768 +8.3% | $76,600 +2.8% |
| 2024 | $1,632 +0.5% | $74,500 +8.3% |
| 2023 | $1,624 +24.4% | $68,800 |
| 2022 | $1,306 +8.9% | $68,800 +21.6% |
| 2021 | $1,200 +342% | $56,600 +9.3% |
| 2020 | $271 +14.2% | $51,800 +10.2% |
| 2019 | $238 +14.9% | $47,000 +12.7% |
| 2018 | $207 -16.8% | $41,700 +13.3% |
| 2017 | $248 +20.1% | $36,800 -8.5% |
| 2016 | $207 +2.4% | $40,200 +2.6% |
| 2014 | $202 -28.2% | $39,200 -13.1% |
| 2013 | $281 | $45,100 -0.2% |
| 2012 | $281 | $45,200 -2.6% |
| 2011 | -- | $46,400 |
| 2010 | $272 +5.1% | $46,400 -4.3% |
| 2009 | $259 | $48,500 -4.9% |
| 2007 | -- | $51,000 -1% |
| 2006 | -- | $51,500 +37.3% |
| 2005 | -- | $37,500 |
| 2004 | -- | $37,500 |
| 2003 | -- | $37,500 +88.4% |
| 2002 | -- | $19,900 +200.2% |
| 2001 | -- | $6,630 |
| 2000 | -- | $6,630 |
Find assessor info on the county website
Monthly payment
Est. payment
Payment breakdown
Explore the cost of this home by adjusting the details. Changes won't be saved.Climate risks
Neighborhood: 46203
- $192,9003 bd2 ba1.5k sqft2501 Harlan St, Indianapolis, IN 46203Off Market

- $182,8003 bd2 ba1.3k sqft2232 Spann Ave, Indianapolis, IN 46203Off Market
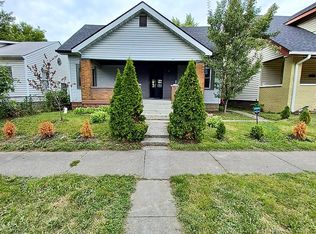
- $91,6005 bd1 ba1.2k sqft1444 S Colorado Ave, Indianapolis, IN 46203Off Market
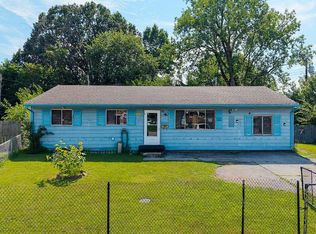
- $65,0003 bd2 ba1.5k sqft4329 Little Leaf Cir, Indianapolis, IN 46203For Sale By Owner
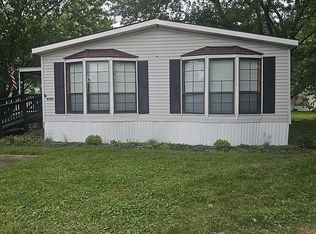
Similar homes
- $169,9993 bd-- ba1.2k sqft2844 Dietz St, Indianapolis, IN 46203For Sale By Owner
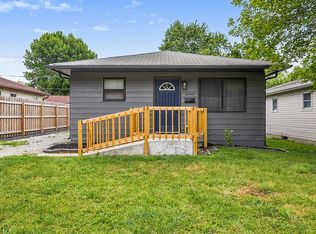
- $155,0003 bd1 ba931 sqft1808 Dayton Ave, Indianapolis, IN 46203Active
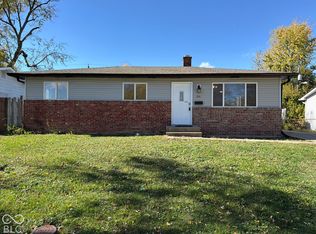 MLS ID #22135750, Shelby Farrar, Opendoor Brokerage LLC. MIBOR as distributed by MLS GRID
- $165,0003 bd1 ba1k sqft1147 S Chester Ave, Indianapolis, IN 46203Active
 MLS ID #22134423, Nancy Hernandez, F.C. Tucker Company. MIBOR as distributed by MLS GRID
- $155,0002 bd1 ba914 sqft1857 Calvin St, Indianapolis, IN 46203Active
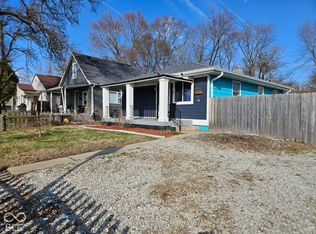 MLS ID #22135935, Sandra Moreno Corona, AMR Real Estate LLC. MIBOR as distributed by MLS GRID
- $135,5003 bd2 ba823 sqft1633 Finley Ave, Indianapolis, IN 46203For Sale
 MLS ID #845388, Keri Hir, Keri Hir. NIRA as distributed by MLS GRID
