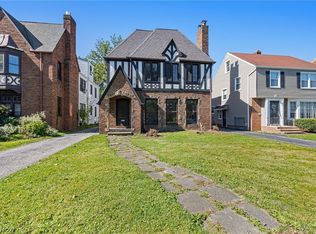
Explore this income-producing, all-brick two-family home in Shaker Heights! Both units are currently occupied with leases extending through April 2027 for the upper unit and March 2028 for the lower unit. The property offers spacious living areas, hardwood floors, dining rooms with built-ins, and a three-car detached garage. A full basement provides additional storage and shared space. With established rental income and classic architectural character, this property is a great opportunity to add to your investment portfolio. Schedule your showing today!
Active
Price cut: $6K (11/11)
$343,900
3710 Lynnfield Rd, Shaker Heights, OH 44122
6beds
2,951sqft
Duplex, Multi Family
Built in 1937
-- sqft lot
$-- Zestimate®
$117/sqft
$-- HOA
What's special
Three-car detached garageHardwood floorsDining rooms with built-insAll-brick two-family home
- 15 days
- 386
- 39
Zillow last checked:
Listing updated:
Listed by:
Mario Russo 216-252-6580 marketing@lokalrealestate.com,
Lokal Real Estate, LLC.
Source: MLS Now,MLS#: 5251293 Originating MLS: Akron Cleveland Association of REALTORS
Facts & features
Interior
Bedrooms & bathrooms
- Bedrooms: 6
- Bathrooms: 3
- Full bathrooms: 3
Heating
- Forced Air, Gas
Cooling
- None
Features
- Basement: Unfinished
Interior area
- Total structure area: 2,951
- Total interior livable area: 2,951 sqft
- Finished area above ground: 2,951
Video & virtual tour
Property
Parking
- Total spaces: 3
- Parking features: Detached, Garage, Paved
- Garage spaces: 3
Features
- Levels: Three Or More
- Stories: 3
Lot
- Size: 5,601 Square Feet
Details
- Parcel number: 73618162
- Special conditions: Standard
Construction
Type & style
- Home type: MultiFamily
- Property subtype: Duplex, Multi Family
Materials
- Brick
- Roof: Asphalt,Shingle
Condition
- Year built: 1937
Utilities & green energy
- Sewer: Public Sewer
- Water: Public
Community & HOA
Community
- Subdivision: Vansweringen
Location
- Region: Shaker Heights
Financial & listing details
- Price per square foot: $117/sqft
- Tax assessed value: $155,000
- Annual tax amount: $6,442
- Date on market: 10/27/2026
- Cumulative days on market: 16 days
Estimated market value
Not available
Estimated sales range
Not available
Not available
Price history
| Date | Event | Price |
|---|---|---|
| 11/11/2026 | Price change | $343,900-1.7%$117/sqft |
Source:  MLS Now #5251293 Report a problem | ||
| 10/27/2026 | Listed for sale | $349,900+125.7%$119/sqft |
Source: MLS Now #5251293 Report a problem | ||
| 5/3/2021 | Sold | $155,000-3.1%$53/sqft |
Source: Public Record Report a problem | ||
| 1/1/2021 | Listing removed | $159,900$54/sqft |
Source: Century 21 HomeStar #4222236 Report a problem | ||
| 9/10/2020 | Listed for sale | $159,900+52.3%$54/sqft |
Source: Century 21 HomeStar #4222236 Report a problem | ||
| 9/30/2016 | Sold | $105,000-4.5%$36/sqft |
Source: MLS Now #3782166 Report a problem | ||
| 6/25/2016 | Pending sale | $110,000$37/sqft |
Source: Keller Williams - KW Chervenic Realty #3782166 Report a problem | ||
| 2/18/2016 | Listed for sale | $110,000+12.8%$37/sqft |
Source: Keller Williams - KW Chervenic Realty #3782166 Report a problem | ||
| 8/14/2014 | Listing removed | $950 |
Source: Keller Williams Chervenic Rlty #3635021 Report a problem | ||
| 7/11/2014 | Listed for rent | $950+11.8% |
Source: Keller Williams Chervenic Rlty #3635021 Report a problem | ||
| 9/12/2013 | Listing removed | $850 |
Source: Keller Williams Chervenic Rlty #3421385 Report a problem | ||
| 6/27/2013 | Listed for rent | $850 |
Source: Chervenic Realty Inc #3421385 Report a problem | ||
| 5/13/2012 | Listing removed | $850 |
Source: Chervenic Realty Inc #3308273 Report a problem | ||
| 4/24/2012 | Sold | $97,500+143.8%$33/sqft |
Source: Public Record Report a problem | ||
| 4/11/2012 | Listed for rent | $850 |
Source: Chervenic Realty Inc #3308273 Report a problem | ||
| 1/19/2012 | Sold | $40,000-27.1%$14/sqft |
Source: MLS Now #3234644 Report a problem | ||
| 1/3/2012 | Pending sale | $54,900$19/sqft |
Source: Coldwell Banker Hunter Realty #3234644 Report a problem | ||
| 1/2/2012 | Listed for sale | $54,900$19/sqft |
Source: Coldwell Banker Hunter Realty #3234644 Report a problem | ||
| 12/27/2011 | Pending sale | $54,900$19/sqft |
Source: Coldwell Banker Hunter Realty #3234644 Report a problem | ||
| 12/12/2011 | Listed for sale | $54,900$19/sqft |
Source: Coldwell Banker Hunter Realty #3234644 Report a problem | ||
| 12/5/2011 | Pending sale | $54,900$19/sqft |
Source: Coldwell Banker Hunter Realty #3234644 Report a problem | ||
| 10/15/2011 | Price change | $54,900-21%$19/sqft |
Source: Coldwell Banker Hunter Realty #3234644 Report a problem | ||
| 7/16/2011 | Price change | $69,500-9.2%$24/sqft |
Source: Hunter Realty #3234644 Report a problem | ||
| 6/9/2011 | Listed for sale | $76,500+4.3%$26/sqft |
Source: Hunter Realty #3234644 Report a problem | ||
| 9/20/2010 | Sold | $73,334-55%$25/sqft |
Source: Public Record Report a problem | ||
| 6/2/2000 | Sold | $163,000$55/sqft |
Source: MLS Now #999261 Report a problem | ||
Public tax history
| Year | Property taxes | Tax assessment |
|---|---|---|
| 2025 | $5,465 +13.7% | $54,250 |
| 2024 | $4,808 -23% | $54,250 -2.2% |
| 2023 | $6,245 +3.5% | $55,480 |
| 2022 | $6,035 -1.1% | $55,480 |
| 2021 | $6,101 +3.2% | $55,480 +10.1% |
| 2020 | $5,910 +1.5% | $50,400 |
| 2019 | $5,825 -0.6% | $50,400 |
| 2018 | $5,859 +37% | $50,400 +44.7% |
| 2017 | $4,277 -74.2% | $34,830 |
| 2016 | $16,573 +4.1% | $34,830 |
| 2015 | $15,928 +56.5% | $34,830 +2.1% |
| 2014 | $10,178 +7.8% | $34,130 -35% |
| 2013 | $9,437 +58.9% | $52,470 |
| 2012 | $5,937 +809.5% | $52,470 -13.2% |
| 2011 | $653 -89.9% | $60,450 |
| 2010 | $6,492 -30.3% | $60,450 |
| 2009 | $9,315 +54.4% | $60,450 -7% |
| 2008 | $6,033 +2.1% | $65,000 |
| 2007 | $5,908 +1.7% | $65,000 |
| 2006 | $5,808 +16.8% | $65,000 +13.9% |
| 2005 | $4,973 +2.3% | $57,050 |
| 2004 | $4,863 +3.4% | $57,050 |
| 2003 | $4,703 +0.5% | $57,050 |
| 2002 | $4,677 -54.6% | $57,050 |
| 2001 | $10,303 -5.6% | $57,050 -5.6% |
| 2000 | $10,917 | $60,450 |
Find assessor info on the county website
Monthly payment
Est. payment
Payment breakdown
Explore the cost of this home by adjusting the details. Changes won't be saved.Climate risks
Neighborhood: Lomond
Nearby schools
Schools provided by the listing agent
- District: Shaker Heights CSD - 1827
Source: MLS Now. This data may not be complete. We recommend contacting the local school district to confirm school assignments for this home.


Similar homes
- $299,9006 bd3 ba2.3k sqft3638 Lynnfield Rd, Shaker Heights, OH 44122For Sale
 MLS ID #5219478, Bobby Heller, Keller Williams Chervenic Rlty. MLS Now
- $315,0004 bd3 ba2.4k sqft18128 Scottsdale Blvd, Shaker Heights, OH 44122For Sale
 MLS ID #5259217, Susan Lenahan, Howard Hanna. MLS Now
- $309,9007 bd3 ba3.4k sqft3670 Winchell Rd, Shaker Heights, OH 44122For Sale
 MLS ID #5244892, Michael L Anter, JAMM Real Estate Co.. MLS Now
- $369,9007 bd3 ba3.2k sqft18518 Newell Rd, Shaker Heights, OH 44122For Sale
 MLS ID #5245993, Alex Severyn, Elite Sotheby's International Realty. MLS Now
