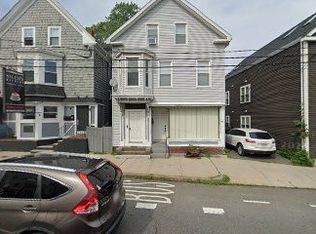
39 Salem Street contains three, renovated (3) 3-Bedroom/1-Bathroom units with 3,391 square feet of gross living area in 5,521 square feet of gross area. The Property is situated upon a 0.07-acre parcel and features eight (8) off-street parking spaces via four (4) tandem pairs. 39 Salem Street is well-positioned in Salem, offering strong access to the city’s historic downtown, neighborhood retail corridors, and surrounding residential neighborhoods. Situated in “The Point” neighborhood of Salem, 39 Salem Street offers residents proximity to Palmer Cove to the south, as well as being walking distance from attractions such as the Salem Harbor Walk, Peabody Essex Museum, Salem Witch Museum, and Salem Common. Tenants are responsible for electric baseboard heating, electric powered hot water, and separately metered electricity. The Landlord is responsible for providing city water & sewer.
Pending
$995,000
39 Salem St, Salem, MA 01970
9beds
3,391sqft
3 Family
Built in 1915
-- sqft lot
$975,800 Zestimate®
$293/sqft
$-- HOA
What's special
- 34 days
- 312
- 27
Zillow last checked:
Listing updated:
Listed by:
Stephen Girolamo 978-406-1789,
Horvath & Tremblay 781-776-4000
Source: MLS PIN,MLS#: 73581012
Facts & features
Interior
Bedrooms & bathrooms
- Bedrooms: 9
- Bathrooms: 3
- Full bathrooms: 3
Heating
- Electric
Features
- Basement: Unfinished
- Has fireplace: No
Interior area
- Total structure area: 3,391
- Total interior livable area: 3,391 sqft
- Finished area above ground: 3,391
Property
Parking
- Total spaces: 8
- Parking features: Paved Drive, Off Street, Paved
- Uncovered spaces: 8
Features
- Waterfront features: Harbor, 1/2 to 1 Mile To Beach, Beach Ownership(Private)
Lot
- Size: 3,049 Square Feet
- Features: Level
Details
- Parcel number: 2135691
- Zoning: R3
Construction
Type & style
- Home type: MultiFamily
- Property subtype: 3 Family
Materials
- Foundation: Stone
- Roof: Shingle
Condition
- Year built: 1915
Utilities & green energy
- Electric: Individually Metered
- Sewer: Public Sewer
- Water: Public
Community & HOA
Community
- Features: Public Transportation, Shopping, Pool, Tennis Court(s), Park, Walk/Jog Trails, Stable(s), Golf, Medical Facility, Laundromat, Bike Path, Conservation Area, Highway Access, House of Worship, Marina, Private School, Public School, T-Station, University, Other
Location
- Region: Salem
Financial & listing details
- Price per square foot: $293/sqft
- Tax assessed value: $748,500
- Annual tax amount: $8,139
- Date on market: 9/22/2026
- Total actual rent: 7668
- Road surface type: Paved
Estimated market value
$975,800
$927,000 - $1.02M
$3,030/mo
Price history
| Date | Event | Price |
|---|---|---|
| 10/7/2026 | Pending sale | $995,000$293/sqft |
Source: MLS PIN #73581012 Report a problem | ||
| 9/22/2026 | Listed for sale | $995,000+249.1%$293/sqft |
Source: MLS PIN #73581012 Report a problem | ||
| 12/31/2021 | Sold | $285,000-31.3%$84/sqft |
Source: MLS PIN #72923323 Report a problem | ||
| 11/29/2021 | Pending sale | $414,900$122/sqft |
Source:  RE/MAX International #72923323 Report a problem | ||
| 9/20/2019 | Listing removed | $414,900$122/sqft |
Source: RE/MAX Encore #72531933 Report a problem | ||
| 9/9/2019 | Price change | $414,900-4.6%$122/sqft |
Source: RE/MAX Encore #72531933 Report a problem | ||
| 7/10/2019 | Listed for sale | $434,900+5%$128/sqft |
Source: RE/MAX Encore #72531933 Report a problem | ||
| 6/25/2019 | Sold | $414,000+42.8%$122/sqft |
Source: Public Record Report a problem | ||
| 4/15/2016 | Listing removed | $290,000$86/sqft |
Source: J. Barrett & Company #71957394 Report a problem | ||
| 3/16/2016 | Price change | $290,000-6.5%$86/sqft |
Source: J. Barrett & Company #71957394 Report a problem | ||
| 2/29/2016 | Price change | $310,000-6.9%$91/sqft |
Source: J. Barrett & Company #71957394 Report a problem | ||
| 2/9/2016 | Listed for sale | $333,000+22.2%$98/sqft |
Source: J. Barrett & Company #71957394 Report a problem | ||
| 11/14/2014 | Sold | $272,424+2.3%$80/sqft |
Source: Public Record Report a problem | ||
| 1/31/2007 | Sold | $266,250$79/sqft |
Source: Public Record Report a problem | ||
Public tax history
| Year | Property taxes | Tax assessment |
|---|---|---|
| 2025 | $7,353 +7.4% | $648,400 +10% |
| 2024 | $6,847 +5.7% | $589,200 +13.7% |
| 2023 | $6,480 | $518,000 |
| 2022 | $6,480 +21.1% | $518,000 +33.6% |
| 2021 | $5,350 +7.9% | $387,700 +13% |
| 2020 | $4,959 +2.8% | $343,200 +7.5% |
| 2019 | $4,823 +7.7% | $319,400 +9.7% |
| 2018 | $4,477 +4.7% | $291,100 +8% |
| 2017 | $4,276 +1.2% | $269,600 |
| 2016 | $4,225 +17.6% | $269,600 +23.1% |
| 2015 | $3,594 +4.1% | $219,000 +6.1% |
| 2014 | $3,453 +2.3% | $206,400 -4.4% |
| 2012 | $3,376 -12.2% | $216,000 -15.4% |
| 2011 | $3,844 -2.7% | $255,400 -9.4% |
| 2010 | $3,951 -4.4% | $282,000 -11.8% |
| 2009 | $4,133 +1.9% | $319,900 -7.9% |
| 2008 | $4,054 -6.1% | $347,400 -13.3% |
| 2007 | $4,316 -10.1% | $400,700 -6.5% |
| 2006 | $4,802 +7.9% | $428,400 +9.6% |
| 2005 | $4,450 +3.8% | $391,000 +6.8% |
| 2004 | $4,286 +34.7% | $366,000 +48.1% |
| 2003 | $3,181 +17.7% | $247,200 +23.8% |
| 2002 | $2,702 +65.1% | $199,700 +85.1% |
| 1999 | $1,637 +3.8% | $107,900 -13.5% |
| 1994 | $1,577 | $124,700 |
Find assessor info on the county website
Monthly payment
Est. payment
Payment breakdown
Explore the cost of this home by adjusting the details. Changes won't be saved.Climate risks
Neighborhood: 01970


Similar homes
- $925,0009 bd4 ba4.4k sqft19 Nichols St, Salem, MA 01970For Sale
 MLS ID #73594996, Francesca Little, Little & Co., REALTORS®. MLS PIN
- $950,0006 bd6 ba3.3k sqft249 Loring Ave, Salem, MA 01970For Sale
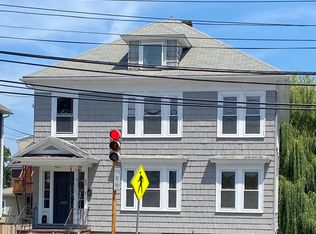 MLS ID #73542504, Alexander Barmin, Averbuch Realty. MLS PIN
- $999,9909 bd3 ba4.7k sqft11 Hutchinson Ct, Lynn, MA 01902For Sale
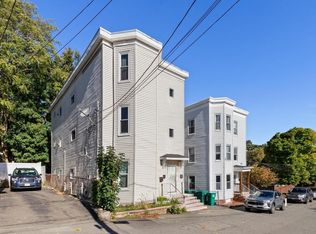 MLS ID #73593455, Laura Gunn, Toner Real Estate, LLC. MLS PIN
- $1,200,0007 bd4 ba3.1k sqft94 North St, Salem, MA 01970For Sale By Owner