$452,100
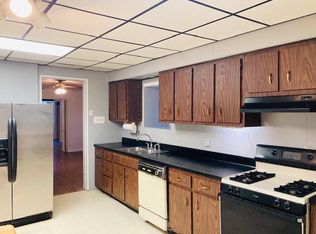
3 bd|3 ba|2.2k sqft
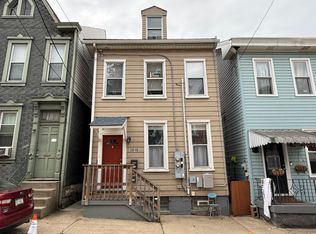
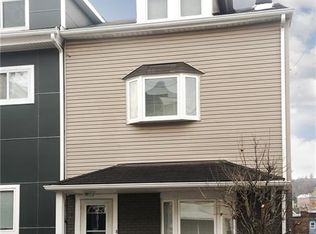
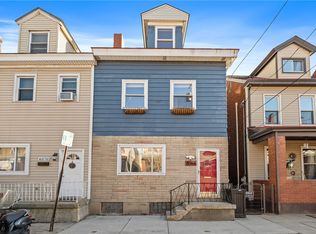
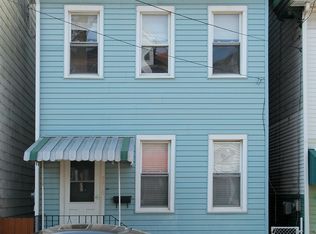
3916 Howley St, Pittsburgh, PA 15224
Off Market
Zillow last checked:
Listing updated:
Ali Budak 412-363-4000,
COLDWELL BANKER REALTY 412-363-4000
$293,300
$279,000 - $308,000
$2,121/mo
| Date | Event | Price |
|---|---|---|
| 7/2/2026 | Price change | $299,900-3.3%$221/sqft |
Source: | ||
| 6/10/2026 | Price change | $310,000-3.1%$228/sqft |
Source: | ||
| 5/13/2026 | Listed for sale | $320,000+45.5%$235/sqft |
Source: | ||
| 5/18/2024 | Listing removed | -- |
Source: Zillow Rentals Report a problem | ||
| 5/16/2024 | Listed for rent | $2,000+11.1%$1/sqft |
Source: Zillow Rentals Report a problem | ||
| 4/19/2023 | Listing removed | -- |
Source: Zillow Rentals Report a problem | ||
| 4/16/2023 | Listed for rent | $1,800$1/sqft |
Source: Zillow Rentals Report a problem | ||
| 4/14/2023 | Sold | $220,000-7.9%$162/sqft |
Source: | ||
| 3/11/2023 | Contingent | $239,000$176/sqft |
Source: | ||
| 2/17/2023 | Price change | $239,000-4%$176/sqft |
Source: | ||
| 1/16/2023 | Price change | $249,000-3.9%$183/sqft |
Source: | ||
| 12/7/2022 | Listed for sale | $259,000$190/sqft |
Source: | ||
| 11/15/2022 | Contingent | $259,000$190/sqft |
Source: | ||
| 11/2/2022 | Price change | $259,000-3.7%$190/sqft |
Source: | ||
| 9/1/2022 | Price change | $269,000-2%$198/sqft |
Source: | ||
| 8/12/2022 | Price change | $274,500-1.8%$202/sqft |
Source: | ||
| 7/16/2022 | Price change | $279,500-0.2%$206/sqft |
Source: | ||
| 7/2/2022 | Listed for sale | $280,000$206/sqft |
Source: | ||
| 6/22/2022 | Contingent | $280,000$206/sqft |
Source: | ||
| 6/16/2022 | Listed for sale | $280,000+116.2%$206/sqft |
Source: | ||
| 12/30/2009 | Sold | $129,500+317.7%$95/sqft |
Source: WPMLS #801221 Report a problem | ||
| 9/25/2007 | Sold | $31,000-15.1%$23/sqft |
Source: Public Record Report a problem | ||
| 7/1/1994 | Sold | $36,500$27/sqft |
Source: Public Record Report a problem | ||
| Year | Property taxes | Tax assessment |
|---|---|---|
| 2025 | $2,744 +6.8% | $111,500 |
| 2024 | $2,569 +387.1% | $111,500 |
| 2023 | $527 | $111,500 |
| 2022 | $527 | $111,500 |
| 2021 | $527 +2% | $111,500 |
| 2020 | $517 -2% | $111,500 |
| 2019 | $527 -79.1% | $111,500 |
| 2018 | $2,523 | $111,500 |
| 2017 | $2,523 +378.4% | $111,500 |
| 2016 | $527 -47% | $111,500 +147.8% |
| 2015 | $996 | $45,000 |
| 2014 | -- | $45,000 -6.3% |
| 2013 | -- | $48,000 +1197.3% |
| 2012 | -- | $3,700 -80.2% |
| 2011 | -- | $18,700 |
| 2010 | -- | $18,700 |
| 2009 | -- | $18,700 |
| 2008 | -- | $18,700 |
| 2007 | -- | $18,700 |
| 2006 | -- | $18,700 |
| 2005 | -- | $18,700 |
| 2004 | -- | $18,700 |
| 2003 | -- | $18,700 |
| 2002 | -- | $18,700 |
Find assessor info on the county website
Source: WPMLS. This data may not be complete. We recommend contacting the local school district to confirm school assignments for this home.
A local agent can set up tours, give advice and negotiate with sellers.
A local lender can help you make sure your offer is ready when you are.