This 696 square foot mobile / manufactured home has 1 bedrooms and 1.0 bathrooms. This home is located at 395 Tierney St, Perris, CA 92570.
Foreclosed
Street View
Est. $374,300
395 Tierney St, Perris, CA 92570
1beds
1baths
696sqft
MobileManufactured
Built in 1971
8,712 Square Feet Lot
$374,300 Zestimate®
$538/sqft
$-- HOA
Overview
- 658 days
- 220
- 2
Facts & features
Interior
Bedrooms & bathrooms
- Bedrooms: 1
- Bathrooms: 1
Heating
- Other
Cooling
- Central
Features
- Has fireplace: Yes
Interior area
- Total interior livable area: 696 sqft
Property
Lot
- Size: 8,712 Square Feet
Details
- Parcel number: 326114032
Construction
Type & style
- Home type: MobileManufactured
Materials
- Roof: Shake / Shingle
Condition
- Year built: 1971
Community & HOA
Location
- Region: Perris
Financial & listing details
- Price per square foot: $538/sqft
- Tax assessed value: $392,700
Foreclosure details
Estimated market value
$374,300
$307,000 - $449,000
Not available
Price history
| Date | Event | Price |
|---|---|---|
| 12/31/2024 | Sold | $378,300-0.4%$544/sqft |
Source: Public Record Report a problem | ||
| 4/10/2023 | Sold | $380,000+313%$546/sqft |
Source: Public Record Report a problem | ||
| 10/30/2018 | Sold | $92,000$132/sqft |
Source: Public Record Report a problem | ||
Public tax history
| Year | Property taxes | Tax assessment |
|---|---|---|
| 2026 | -- | $392,700 +2% |
| 2025 | $4,419 -0.1% | $385,000 -0.7% |
| 2024 | $4,426 +3.2% | $387,600 +5.6% |
| 2023 | $4,290 +222.3% | $367,199 +230.5% |
| 2022 | $1,331 +1.9% | $111,107 +2% |
| 2021 | $1,306 +1.2% | $108,930 +1% |
| 2020 | $1,290 +52.3% | $107,814 +54% |
| 2019 | $847 +222.4% | $70,000 +248.7% |
| 2018 | $263 +1.2% | $20,073 +2% |
| 2017 | $260 | $19,680 +2% |
| 2016 | $260 +3.5% | $19,296 +1.5% |
| 2015 | $251 +2% | $19,009 +2% |
| 2014 | $246 | $18,639 +0.4% |
| 2013 | -- | $18,556 +2% |
| 2012 | -- | $18,193 +2% |
| 2011 | -- | $17,837 +0.7% |
| 2010 | -- | $17,706 -0.2% |
| 2009 | -- | $17,750 +2% |
| 2008 | -- | $17,403 +2% |
| 2007 | -- | $17,062 +2% |
| 2006 | -- | $16,728 +2% |
| 2005 | -- | $16,401 +3.9% |
| 2003 | -- | $15,787 +2% |
| 2002 | -- | $15,478 +2% |
| 2001 | $192 +1.5% | $15,175 +2% |
| 2000 | $189 | $14,879 |
Find assessor info on the county website
Monthly payment
Climate risks
Neighborhood: 92570

Similar homes
- $295,0002 bd1 ba672 sqft22735 Lukens Ln, Perris, CA 92570For Sale
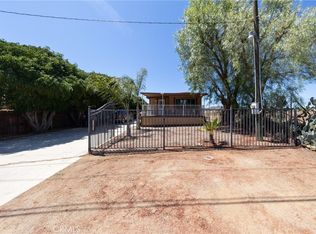 MLS ID #TR26183239, Marta Liceaga, Elevate Real Estate Agency. CRMLS
- $394,9993 bd2 ba900 sqft312 Redbud Pl, Perris, CA 92570For Sale
 MLS ID #DW26189521, Carmen Sanchez, Real Broker. CRMLS
- $350,0001 bd1 ba818 sqft174 E 11th St, Perris, CA 92570For Sale
 MLS ID #TR26184749, Karina Diaz, Homequest Real Estate. CRMLS
- $375,0002 bd2 ba992 sqft26730 Saint Andrews Dr, Menifee, CA 92586For Sale
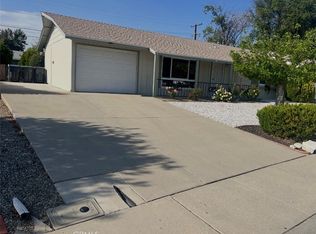 MLS ID #SW26184457, Rachel Rathbone, Coldwell Banker Realty. CRMLS
