40 Connolly Drive is a 2 bed 1 bath single family home in Saint Louis, MO 63135 totaling 768 sq ft located within the Ferguson-Florissant School District. This property was recently updated with modern finishes and also includes off-street parking as well as a large backyard. 40 Connolly Dr is currently being leased through 3/31/27 for $905/m.
Active
Listed by: Salient Realty Group, LLC • Matt G Millslagle • 314-323-3340
$120,000
40 Connolly Dr, Saint Louis, MO 63135
2beds
768sqft
Single Family Residence
Built in 1950
6,250 Square Feet Lot
$-- Zestimate®
$156/sqft
$-- HOA
What's special
Large backyardOff-street parking
- 20 days
- 68
- 7
Zillow last checked:
Listing updated:
Listed by:
Matt G Millslagle 314-323-3340,
Salient Realty Group, LLC,
Tyler Alms,
Salient Realty Group, LLC
Source: MARIS,MLS#: 26062338 Originating MLS: St. Louis Association of REALTORS
Facts & features
Interior
Bedrooms & bathrooms
- Bedrooms: 2
- Bathrooms: 1
- Full bathrooms: 1
- Main level bathrooms: 1
- Main level bedrooms: 2
Heating
- Forced Air
Cooling
- Central Air
Features
- Basement: Unfinished
- Has fireplace: No
Interior area
- Total structure area: 768
- Total interior livable area: 768 sqft
- Finished area above ground: 768
Property
Features
- Levels: One
Lot
- Size: 6,250 Square Feet
- Features: Back Yard, Front Yard
Details
- Parcel number: 10J540692
- Special conditions: Standard
Construction
Type & style
- Home type: SingleFamily
- Architectural style: Other
- Property subtype: Single Family Residence
Materials
- Vinyl Siding
Condition
- Year built: 1950
Utilities & green energy
- Electric: Single Phase
- Sewer: Public Sewer
- Water: Public
- Utilities for property: Electricity Connected, Sewer Connected, Water Connected
Community & HOA
Community
- Subdivision: Burke City
HOA
- Has HOA: No
Location
- Region: Saint Louis
Financial & listing details
- Price per square foot: $156/sqft
- Tax assessed value: $66,200
- Annual tax amount: $978
- Date on market: 9/29/2026
- Listing terms: Conventional
- Electric utility on property: Yes
Estimated market value
Not available
Estimated sales range
Not available
Not available
Price history
| Date | Event | Price |
|---|---|---|
| 9/29/2026 | Listed for sale | $120,000+73.9%$156/sqft |
Source:  MARIS #26062338 Report a problem | ||
| 4/11/2026 | Listing removed | $1,290$2/sqft |
Source: Zillow Rentals Report a problem | ||
| 4/1/2026 | Listed for rent | $1,290$2/sqft |
Source: Zillow Rentals Report a problem | ||
| 3/7/2026 | Listing removed | $1,290$2/sqft |
Source: Zillow Rentals Report a problem | ||
| 2/28/2026 | Listed for rent | $1,290+66.5%$2/sqft |
Source: Zillow Rentals Report a problem | ||
| 12/2/2025 | Sold | -- |
Source: MARIS #25071150 Report a problem | ||
| 11/4/2025 | Pending sale | $69,000$90/sqft |
Source: MARIS #25071150 Report a problem | ||
| 10/23/2025 | Sold | -- |
Source: Public Record Report a problem | ||
| 10/22/2025 | Listed for sale | $69,000$90/sqft |
Source: MARIS #25071150 Report a problem | ||
| 4/24/2022 | Listing removed | -- |
Source: Zillow Rental Network Premium Report a problem | ||
| 4/19/2022 | Listed for rent | $775+11.5%$1/sqft |
Source: Zillow Rental Network Premium Report a problem | ||
| 9/8/2018 | Listing removed | $695$1/sqft |
Source: BJDA HOMES, LLC Report a problem | ||
| 8/16/2018 | Listed for rent | $695$1/sqft |
Source: BJDA HOMES, LLC Report a problem | ||
| 4/19/2013 | Sold | -- |
Source: Public Record Report a problem | ||
| 6/15/2012 | Sold | -- |
Source: Public Record Report a problem | ||
| 1/5/2005 | Sold | -- |
Source: Public Record Report a problem | ||
| 2/12/1999 | Sold | -- |
Source: Public Record Report a problem | ||
| 4/13/1998 | Sold | -- |
Source: Public Record Report a problem | ||
Public tax history
| Year | Property taxes | Tax assessment |
|---|---|---|
| 2025 | $978 +4.1% | $12,580 +6.8% |
| 2024 | $939 +0.4% | $11,780 |
| 2023 | $935 +21.1% | $11,780 +38.9% |
| 2022 | $772 +0.3% | $8,480 |
| 2021 | $770 +33.4% | $8,480 +45.2% |
| 2020 | $577 -16.7% | $5,840 -37.1% |
| 2019 | $693 | $9,280 +43.7% |
| 2018 | $693 | $6,460 -17.9% |
| 2017 | $693 -16.9% | $7,870 +2.5% |
| 2016 | $833 -0.2% | $7,680 |
| 2015 | $835 | $7,680 -27.8% |
| 2014 | $835 -25% | $10,640 |
| 2013 | $1,114 | $10,640 |
| 2012 | -- | $10,640 |
| 2011 | -- | $10,640 -11.3% |
| 2010 | $1,042 +6% | $11,990 |
| 2009 | $983 +2.1% | $11,990 -1.6% |
| 2008 | $962 +29.2% | $12,180 |
| 2007 | $745 | $12,180 +42.1% |
| 2006 | $745 -0.3% | $8,570 |
| 2005 | $747 -3.5% | $8,570 +7.1% |
| 2003 | $775 +2.5% | $8,000 -6.1% |
| 2002 | $756 +28.7% | $8,520 |
| 2001 | $587 | $8,520 |
Find assessor info on the county website
Monthly payment
Est. payment
Payment breakdown
Explore the cost of this home by adjusting the details. Changes won't be saved.Climate risks
Neighborhood: 63135
Nearby schools
Schools provided by the listing agent
- Elementary: Airport Elem.
- Middle: Cross Keys Middle
- High: Mccluer High
Source: MARIS. This data may not be complete. We recommend contacting the local school district to confirm school assignments for this home.


Similar homes
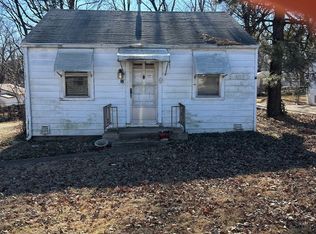
- $120,0002 bd1 ba792 sqft3581 Valleywood Dr, Saint Louis, MO 63114For Sale
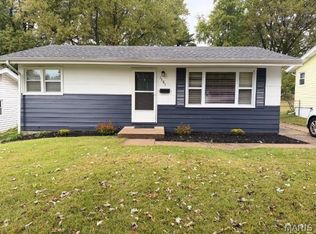
 MLS ID #26066926, Sandi Taschler, Coldwell Banker Realty - Gundaker. MARIS
- $119,5002 bd1 ba816 sqft840 Pershall Rd, Florissant, MO 63031For Sale
 MLS ID #26045719, Avery Sanders, Coldwell Banker Realty - Gundaker. MARIS
- $115,0002 bd1 ba936 sqft283 S Barat Ave, Saint Louis, MO 63135For Sale
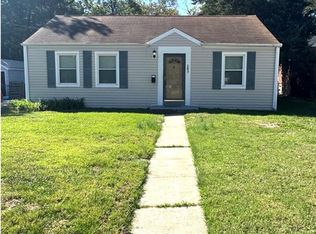 MLS ID #26050218, James E Little, JEL Realty LLC. MARIS
- $125,0003 bd1 ba864 sqft6824 Larry Ln, Saint Louis, MO 63134For Sale
 MLS ID #26051779, Hiro Sato, Prime Home Property Management. MARIS
- $122,9003 bd1 ba864 sqft517 Teston Dr, Saint Louis, MO 63135For SaleMLS ID #26032464, Geneva C Dotson, Just Wright Realty. MARIS
- $118,0002 bd1 ba855 sqft10153 Earl Dr, Saint Louis, MO 63136For SaleMLS ID #26062334, Matt G Millslagle, Salient Realty Group, LLC. MARIS
- $130,0003 bd1 ba1k sqft10 Drummond Dr, Saint Louis, MO 63135For SaleMLS ID #26034256, Josh J Cox, The Closing Pros LLC. MARIS
- $118,0002 bd1 ba770 sqft10404 Earl Dr, Saint Louis, MO 63136For SaleMLS ID #26062332, Matt G Millslagle, Salient Realty Group, LLC. MARIS
- $118,9003 bd1 ba891 sqft6023 Shillington Dr, Berkeley, MO 63134For SaleMLS ID #26060145, Josh D Killian, Avenue Real Estate Group. MARIS
- $133,5003 bd1 ba960 sqft104 Fenwick Dr, Saint Louis, MO 63135For SaleMLS ID #26051650, Jaden Barr, Keller Williams Chesterfield. MARIS
- $72,5002 bd1 ba756 sqft60 Connolly Dr, Saint Louis, MO 63135For SaleMLS ID #26050334, Missy A Donati, Soto Property Solutions. MARIS
- $134,9003 bd2 ba1k sqft13 Saint Margaret Ct, Florissant, MO 63031For SaleMLS ID #26054117, Blake W Rasmussen, Vylla Home. MARIS
- $100,0003 bd1 ba840 sqft6812 Brower Ct, Saint Louis, MO 63134For SaleMLS ID #26056566, Krista Hartmann, RE/MAX Results. MARIS
- $135,0002 bd1 ba930 sqft2020 Saint Stephen Dr, Florissant, MO 63033For SaleMLS ID #26057018, Michael V Palmer, Palmer Real Estate LLC. MARIS
- $128,0002 bd1 ba825 sqft1965 Park Ln, Saint Louis, MO 63136For SaleMLS ID #26064735, Michael P Peritore, The Hermann London Group LLC. MARIS
- $125,0003 bd1 ba912 sqft3100 Canfield Dr, Saint Louis, MO 63136For SaleMLS ID #26030212, Miranda Hedrick, Gateway Real Estate. MARIS
- $95,0003 bd1 ba850 sqft10135 Jepson Dr, Saint Louis, MO 63137For SaleMLS ID #26066339, Terry Gannon, RE/MAX Results. MARIS
- $94,9003 bd1 ba1.1k sqft8351 Graybirch Dr, Saint Louis, MO 63134For SaleMLS ID #26058934, Steve LoPiccolo, American Realty Group. MARIS
- $125,0002 bd2 ba1k sqft2440 Akins Dr, Saint Louis, MO 63136For SaleMLS ID #26057937, Rhonda J Hamilton, A-List, LLC. MARIS
- $69,9003 bd1 ba864 sqft4026 Belfore Dr, Saint Louis, MO 63121For SaleMLS ID #26066930, Greg L Williams, BHHS Select Properties. MARIS
