PRICE IMPROVEMENT!Build your investment portfolio or explore the possibilities of owner-occupied two-family living at 38–40 Eddy Street! Offering approximately 2,054 square feet, this property features two separate two story units, off-street parking, and a convenient location near downtown shopping and dining. One unit is currently rented at $1,500 per month, providing established rental income. With room for improvements and your personal vision, this property offers an opportunity to build equity while making the most of its two-family layout. Property needs some repairs and updating and is being sold as-is.
For sale
Price cut: $10K (10/21)
$279,000
40 Eddy St, Ware, MA 01082
6beds
2,054sqft
2 Family - 2 Units Side by Side
Built in 1875
-- sqft lot
$276,300 Zestimate®
$136/sqft
$-- HOA
What's special
Off-street parking
- 60 days
- 376
- 38
Zillow last checked:
Listing updated:
Listed by:
Samantha Berthiaume 413-544-2330,
S. Madigan & Co., LLC 338-788-6573
Source: MLS PIN,MLS#: 73577583
Facts & features
Interior
Bedrooms & bathrooms
- Bedrooms: 6
- Bathrooms: 3
- Full bathrooms: 2
- 1/2 bathrooms: 1
Features
- Basement: Full
- Has fireplace: No
Interior area
- Total structure area: 2,054
- Total interior livable area: 2,054 sqft
- Finished area above ground: 2,054
Property
Parking
- Total spaces: 4
- Uncovered spaces: 4
Features
- Fencing: Fenced/Enclosed
Lot
- Size: 5,355 Square Feet
- Features: Level
Details
- Parcel number: M:0060 B:0000 L:0201,3419478
- Zoning: DTC
Construction
Type & style
- Home type: MultiFamily
- Property subtype: 2 Family - 2 Units Side by Side
Materials
- Foundation: Brick/Mortar
Condition
- Year built: 1875
Utilities & green energy
- Electric: Circuit Breakers
- Sewer: Public Sewer
- Water: Public
Community & HOA
Location
- Region: Ware
Financial & listing details
- Price per square foot: $136/sqft
- Tax assessed value: $190,100
- Annual tax amount: $2,755
- Date on market: 9/15/2026
- Listing terms: Contract
- Total actual rent: 1500
Estimated market value
$276,300
$262,000 - $290,000
$1,759/mo
Price history
| Date | Event | Price |
|---|---|---|
| 10/21/2026 | Price change | $279,000-3.5%$136/sqft |
Source: MLS PIN #73577583 Report a problem | ||
| 9/29/2026 | Price change | $289,000-3.3%$141/sqft |
Source: MLS PIN #73577583 Report a problem | ||
| 9/15/2026 | Listed for sale | $299,000$146/sqft |
Source: MLS PIN #73577583 Report a problem | ||
Public tax history
| Year | Property taxes | Tax assessment |
|---|---|---|
| 2025 | $2,432 +0.2% | $161,500 +8.7% |
| 2024 | $2,427 +5.9% | $148,600 +11.9% |
| 2023 | $2,292 -2.1% | $132,800 +9.7% |
| 2022 | $2,342 +13.6% | $121,100 +18.5% |
| 2021 | $2,062 +3.4% | $102,200 +5.7% |
| 2020 | $1,995 +2.1% | $96,700 |
| 2019 | $1,954 -1.6% | $96,700 +0.8% |
| 2018 | $1,986 -0.1% | $95,900 +0.2% |
| 2017 | $1,988 +2.8% | $95,700 |
| 2016 | $1,934 +2.8% | $95,700 |
| 2015 | $1,881 -3.9% | $95,700 -10.5% |
| 2014 | $1,957 +6.3% | $106,900 -1.7% |
| 2013 | $1,841 -8.2% | $108,700 -13.9% |
| 2012 | $2,005 +2% | $126,200 -4.5% |
| 2011 | $1,966 +2.9% | $132,200 |
| 2010 | $1,910 +3.4% | $132,200 -2.2% |
| 2009 | $1,847 +3.2% | $135,200 +0.4% |
| 2008 | $1,790 +2.9% | $134,600 +3.3% |
| 2007 | $1,740 +9% | $130,300 +14.6% |
| 2006 | $1,596 +25.6% | $113,700 +39.5% |
| 2005 | $1,271 +8.4% | $81,500 +24% |
| 2004 | $1,173 +2.8% | $65,700 |
| 2003 | $1,141 +8.4% | $65,700 +21.7% |
| 2002 | $1,053 | $54,000 |
Find assessor info on the county website
Monthly payment
Est. payment
Payment breakdown
Explore the cost of this home by adjusting the details. Changes won't be saved.Climate risks
Neighborhood: 01082
Similar homes
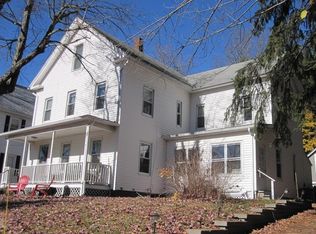
- $295,0005 bd3 ba2.1k sqft27 Walnut St, Ware, MA 01082For Sale
 MLS ID #73581662, King Group, Coldwell Banker Realty - Western MA. MLS PIN
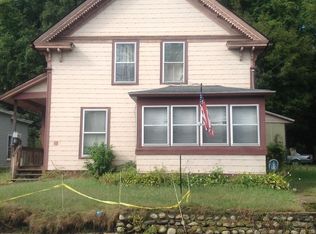
- $--4 bd4 ba2.3k sqft44 South St, Ware, MA 01082Auction
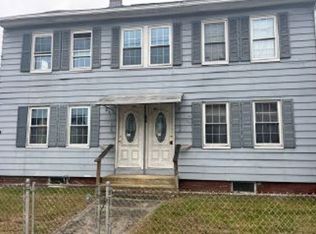 Xome
- $299,0005 bd2 ba2.2k sqft96 East St, Ware, MA 01082For Sale
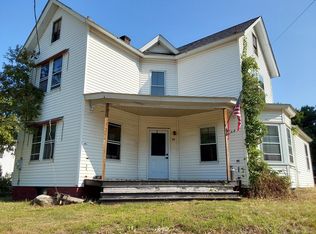 MLS ID #73547767, Candor Investment Group, eXp Realty LLC. MLS PIN
- $349,0007 bd2 ba2.9k sqft7 Pleasant St, Ware, MA 01082For Sale
 MLS ID #73555382, Scott Fontaine, REMAX Connections - Easthampton. MLS PIN
