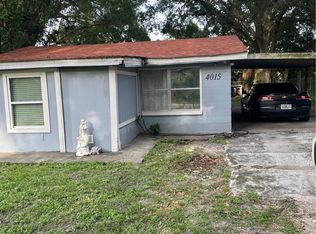
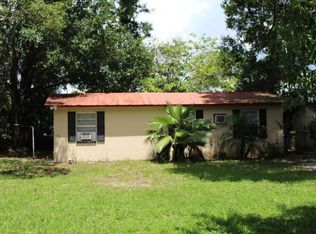
PRICED TO SELL before the 31th of JULY "Exceptional opportunity in the heart of Tampa! This versatile 4-bedroom, 3-bathroom residence is a standout choice for both large households and savvy investors. The property features three independent entry points, providing a unique layout that allows for flexible living arrangements or excellent rental potential (Airbnb/VRBO). SHORT TERM RENTAL Investment income residential property MOTHER IN LAW UNIT and a RV as a part of the deal make your call NOW Situated in a tranquil, CUL DE SAC -loop-style community with no through traffic, this home offers a private atmosphere and enhanced peace of mind. Its prime location places you minutes away from , Downtown Tampa, and Hard Rock Hotel And Casino, with convenient access to Florida’s top-rated beaches. Whether you are looking for a spacious primary residence or a strategic addition to your portfolio, this turnkey property is ready to deliver. Schedule your private showing today!"
For sale
Price cut: $20K (7/16)
$250,000
4017 WATSON ROAD, TAMPA, FL 33610
4beds
1,202sqft
:
Get pre-qualified$1,714/mo
Single Family Residence
Built in 1959
7,150 Square Feet Lot
$250,100 Zestimate®
$208/sqft
$-- HOA
What's special
Three independent entry points
- 45 days |
- 2,378 |
- 186 |
Zillow last checked:
Listing updated:
Listed by:
Rafael Perez Webel 786-342-8687,
DALTON WADE INC 888-668-8283
Source: Stellar MLS,MLS#: TB8520772 Originating MLS: Suncoast Tampa
Facts & features
Interior
Bedrooms & bathrooms
- Bedrooms: 4
- Bathrooms: 3
- Full bathrooms: 3
Primary bedroom
- Features: Built-in Closet
- Level: First
Other
- Features: Built-in Closet
- Level: First
Bedroom 1
- Features: Built-in Closet
- Level: First
Bedroom 2
- Features: Built-in Closet
- Level: First
Bathroom 1
- Features: Built-in Closet
- Level: First
Bathroom 3
- Features: Built-in Closet
- Level: First
Family room
- Features: No Closet
- Level: First
Great room
- Features: No Closet
- Level: First
Kitchen
- Features: Storage Closet
- Level: First
Heating
- Other
Cooling
- Ductless, Wall/Window Unit(s)
Appliances
- Included: Dishwasher, Dryer, Electric Water Heater, Refrigerator, Washer
- Laundry: Laundry Closet
Features
- Accessibility Features, Open Floorplan
- Flooring: Carpet
- Has fireplace: No
Interior area
- Total structure area: 1,202
- Total interior livable area: 1,202 sqft
Video & virtual tour
Property
Features
- Levels: One
- Stories: 1
- Patio & porch: Patio
- Exterior features: Garden, Playground, Private Yard
- Fencing: Board,Fenced
Lot
- Size: 7,150 Square Feet
- Dimensions: 65 x 110
- Features: Cul-De-Sac
- Residential vegetation: Mature Landscaping
Details
- Additional structures: Guest House, Storage
- Parcel number: U06292028800000000009.0
- Zoning: RSC-6
- Special conditions: None
Construction
Type & style
- Home type: SingleFamily
- Property subtype: Single Family Residence
Materials
- Block, Concrete
- Foundation: Slab
- Roof: Shingle
Condition
- New construction: No
- Year built: 1959
Utilities & green energy
- Sewer: Septic Tank
- Water: Private
- Utilities for property: Cable Available, Electricity Connected, Other
Community & HOA
Community
- Pet fee: $0 monthly
- Subdivision: GOLD COAST SUB FIRST ADD
HOA
- Has HOA: No
Location
- Region: Tampa
Financial & listing details
- Price per square foot: $208/sqft
- Tax assessed value: $128,060
- Annual tax amount: $2,895
- Date on market: 6/18/2026
- Cumulative days on market: 183 days
- Ownership: Fee Simple
- Total actual rent: 16800
- Electric utility on property: Yes
- Road surface type: Asphalt
Estimated market value
$250,100
$238,000 - $263,000
$2,353/mo
Price history
| Date | Event | Price |
|---|---|---|
| 7/16/2026 | Price change | $250,000-7.4%$208/sqft |
Source: | ||
| 7/13/2026 | Price change | $270,000-6.5%$225/sqft |
Source: | ||
| 7/5/2026 | Price change | $288,888-3%$240/sqft |
Source: | ||
| 6/24/2026 | Price change | $297,888-0.3%$248/sqft |
Source: | ||
| 6/20/2026 | Pending sale | $298,888$249/sqft |
Source: | ||
| 6/18/2026 | Listed for sale | $298,888+8.7%$249/sqft |
Source: | ||
| 6/17/2026 | Listing removed | $274,999$229/sqft |
Source: | ||
| 5/30/2026 | Price change | $274,999-3.5%$229/sqft |
Source: | ||
| 5/15/2026 | Price change | $285,000-3.1%$237/sqft |
Source: | ||
| 4/16/2026 | Price change | $294,000-1.7%$245/sqft |
Source: | ||
| 3/11/2026 | Listed for sale | $298,999$249/sqft |
Source: | ||
| 2/25/2026 | Pending sale | $298,999$249/sqft |
Source: | ||
| 2/12/2026 | Price change | $298,999-3.5%$249/sqft |
Source: | ||
| 2/2/2026 | Price change | $309,999-2.5%$258/sqft |
Source: | ||
| 1/24/2026 | Price change | $318,000-3.6%$265/sqft |
Source: | ||
| 1/10/2026 | Listed for sale | $330,000+47.3%$275/sqft |
Source: | ||
| 11/17/2022 | Sold | $224,000$186/sqft |
Source: Public Record Report a problem | ||
| 10/13/2022 | Pending sale | $224,000$186/sqft |
Source: | ||
| 10/7/2022 | Price change | $224,000-10.4%$186/sqft |
Source: | ||
| 9/26/2022 | Listed for sale | $249,900+614%$208/sqft |
Source: | ||
| 11/26/2013 | Listing removed | $825$1/sqft |
Source: Zillow Rental Network Report a problem | ||
| 11/15/2013 | Listed for rent | $825$1/sqft |
Source: Zillow Rental Network Report a problem | ||
| 10/27/2011 | Listing removed | $35,000$29/sqft |
Source: isNowListed.com Report a problem | ||
| 10/13/2011 | Listed for sale | $35,000+1.4%$29/sqft |
Source: isNowListed.com Report a problem | ||
| 9/26/2011 | Sold | $34,500-11.5%$29/sqft |
Source: Stellar MLS #T2484688 Report a problem | ||
| 2/7/2011 | Sold | $39,000-72.1%$32/sqft |
Source: Public Record Report a problem | ||
| 1/7/2008 | Sold | $140,000+40%$116/sqft |
Source: Public Record Report a problem | ||
| 10/15/2005 | Sold | $100,000+334.8%$83/sqft |
Source: Public Record Report a problem | ||
| 9/9/1997 | Sold | $23,000$19/sqft |
Source: Public Record Report a problem | ||
Public tax history
| Year | Property taxes | Tax assessment |
|---|---|---|
| 2025 | $2,896 +9.8% | $128,060 +5.1% |
| 2024 | $2,638 -5.2% | $121,853 -7.7% |
| 2023 | $2,782 +84.7% | $132,080 +162.9% |
| 2022 | $1,507 +8.9% | $50,236 +10% |
| 2021 | $1,383 +8.7% | $45,669 +10% |
| 2020 | $1,272 +9.2% | $41,517 +10% |
| 2019 | $1,165 | $37,743 -26.6% |
| 2018 | $1,165 +14.6% | $51,456 +32.7% |
| 2017 | $1,017 +13% | $38,777 +36.7% |
| 2016 | $900 +5.7% | $28,357 +10% |
| 2015 | $851 +3.2% | $25,779 -12.2% |
| 2014 | $825 | $29,345 +10% |
| 2013 | $825 +9.1% | $26,677 +5.1% |
| 2012 | $756 +101.6% | $25,384 -19.5% |
| 2011 | $375 -25.5% | $31,517 -16.9% |
| 2010 | $503 -35.3% | $37,937 -30.8% |
| 2009 | $778 -59% | $54,838 -33.4% |
| 2008 | $1,897 -5.7% | $82,380 -8.3% |
| 2007 | $2,011 +3% | $89,863 +12% |
| 2006 | $1,953 +352.4% | $80,260 +123.4% |
| 2005 | $432 | $35,921 +3% |
| 2004 | -- | $34,875 +1.9% |
| 2003 | -- | $34,225 +2.4% |
| 2002 | -- | $33,423 +1.6% |
| 2001 | -- | $32,897 -8.2% |
| 2000 | $269 | $35,827 |
Find assessor info on the county website
Monthly payment
Est. payment
Payment breakdown
Explore the cost of this home by adjusting the details. Changes won't be saved.Climate risks
Neighborhood: 33610
Nearby schools
GreatSchools rating
- 7/10Kenly Elementary SchoolGrades: PK-5Distance: 2.4 mi
- 3/10Jennings Middle SchoolGrades: 6-8Distance: 3.1 mi
- 4/10Armwood High SchoolGrades: 9-12Distance: 3.4 mi
Schools provided by the listing agent
- Elementary: Kenly-HB
- Middle: Jennings-HB
- High: Armwood-HB
Source: Stellar MLS. This data may not be complete. We recommend contacting the local school district to confirm school assignments for this home.
- $187,6003 bd1 ba1k sqft4015 Watson Rd, Tampa, FL 33610Off Market
- $149,1001 bd1 ba576 sqft4019 Watson Rd, Tampa, FL 33610Off Market
- $215,8002 bd1 ba832 sqft4013 Watson Rd, Tampa, FL 33610Off Market
- $125,4001 bd1 ba520 sqft4020 Watson Rd, Tampa, FL 33610Off Market
- $206,8003 bd1 ba1k sqft4016 Watson Rd, Tampa, FL 33610Off Market
- $202,8002 bd1 ba832 sqft4011 Watson Rd, Tampa, FL 33610Off Market
- $159,7002 bd1 ba726 sqft4014 Watson Rd, Tampa, FL 33610Off Market
- $257,0003 bd2 ba1.4k sqft4022 Watson Rd, Tampa, FL 33610Sold
A local agent can set up tours, give advice and negotiate with sellers.
Similar homes
- $332,0004 bd2 ba1.3k sqft4316 CLEWIS AVENUE, TAMPA, FL 33610For Sale

 MLS ID #O6428140, Steven Koleno, BEYCOME OF FLORIDA LLC. Stellar MLS
 - $245,0003 bd2 ba1k sqft3104 E CHELSEA STREET, TAMPA, FL 33610For Sale
 MLS ID #TB8520069, Eddie Serralles, SERRALLES GROUP,INC. Stellar MLS
 - $265,0002 bd1 ba886 sqft626 S 67TH STREET, TAMPA, FL 33619For Sale
 MLS ID #O6418602, Karen Albright, OPENDOOR BROKERAGE LLC. Stellar MLS
 - $299,0004 bd2 ba1k sqft3001 N 45TH STREET, TAMPA, FL 33605For Sale
 MLS ID #TB8532103, Juan Montes, JPT REALTY LLC. Stellar MLS
 - $289,9003 bd2 ba1.5k sqft4802 E CURTIS STREET, TAMPA, FL 33610For SaleMLS ID #S5148567, Freddy Alvarado, HOMETRUST REALTY GROUP. Stellar MLS
- $319,9004 bd2 ba1.4k sqft2620 E 33RD AVENUE, TAMPA, FL 33610For SaleMLS ID #TB8516336, Wil Sanders, EXP REALTY LLC. Stellar MLS
- $239,0003 bd2 ba1.1k sqft8211 N 10TH STREET, TAMPA, FL 33604For SaleMLS ID #TB8533223, Angie Lee, IMPACT REALTY TAMPA BAY. Stellar MLS
- $275,0002 bd1 ba840 sqft4607 N 35TH STREET, TAMPA, FL 33610For SaleMLS ID #TB8525216, Juan Montes, JPT REALTY LLC. Stellar MLS
- $285,0003 bd2 ba1.2k sqft624 WOOD ROAD, SEFFNER, FL 33584For SaleMLS ID #TB8531242, Matthew Cooper, LLC, KELLER WILLIAMS TAMPA CENTRAL. Stellar MLS
- $309,9903 bd1 ba1.2k sqft1709 E NORTH BAY STREET, TAMPA, FL 33610For SaleMLS ID #TB8518405, Ana Tapia, P.A., DALTON WADE INC. Stellar MLS
- $330,0004 bd1 ba1.3k sqft7507 CORAL VINE LANE, TAMPA, FL 33619For SaleMLS ID #TB8531239, Tanya Wilson, SIGNATURE REALTY ASSOCIATES. Stellar MLS
- $269,0003 bd2 ba840 sqft1119 N PARSONS AVENUE, SEFFNER, FL 33584For SaleMLS ID #TB8532657, Hilda Pantoja, CHARLES RUTENBERG REALTY INC. Stellar MLS
- $275,0003 bd1 ba1.2k sqft8311 N 18TH STREET, TAMPA, FL 33604For SaleMLS ID #O6421688, Tina Ramotar, RAZZANI INTERNATIONAL REALTY. Stellar MLS
- $244,9003 bd2 ba1k sqft8014 N ALASKA STREET, TAMPA, FL 33604For SaleMLS ID #TB8345799, Rima Jbour, CENTURY 21 ROSA LEON. Stellar MLS
- $210,0003 bd1 ba792 sqft2615 E 28TH AVENUE, TAMPA, FL 33605For SaleMLS ID #TB8533872, Nesly Eliscart, PROPERTY SCHOLARS REALTY & DEV. Stellar MLS
- $240,0003 bd1 ba1k sqft11129 ROBERTS LANE, RIVERVIEW, FL 33578For SaleMLS ID #TB8527598, Charlene Weston, WESTON GROUP. Stellar MLS
- $360,9004 bd2 ba1k sqft2619 E CHELSEA STREET, TAMPA, FL 33610For SaleMLS ID #TB8511975, Blanca Lopez Torres, FRIENDS REALTY LLC. Stellar MLS
- $324,9003 bd2 ba1.2k sqft10909 N 14TH STREET, TAMPA, FL 33612For SaleMLS ID #TB8534865, Lynne Powers, POWERS REAL ESTATE SOLUTIONS LLC. Stellar MLS
- $250,0002 bd2 ba1k sqft1807 E WATERS AVENUE, TAMPA, FL 33604For SaleMLS ID #TB8521423, Jennifer Barriffe, P.A., FATHOM REALTY FL LLC. Stellar MLS
- $235,0003 bd2 ba1.2k sqft2415 MARCONI STREET, TAMPA, FL 33605For SaleMLS ID #TB8474757, Daniela Izaguirre, PEOPLE'S CHOICE REALTY SVC LLC. Stellar MLS
