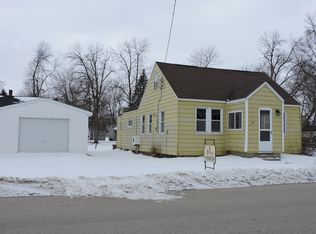
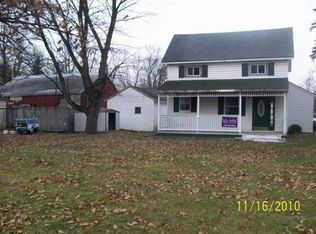
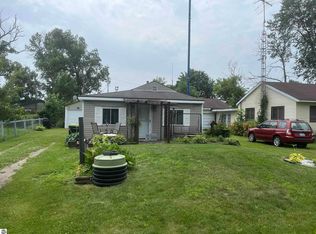
Why Rent When You Can Own? - Welcome to this well-appointed 2-bedroom, 1-bath home offering comfort, charm, and affordability! Step inside to find a bright and inviting kitchen filled with natural light, along with a cozy living room perfect for relaxing or entertaining. The full unfinished basement provides plenty of additional storage space and offers endless possibilities for a future recreation room, or hobby area. Whether you're a first-time homebuyer, looking to downsize, or searching for an investment opportunity, this home is full of potential. Why pay rent when you can enjoy the benefits of owning your own home? Don't miss this great opportunity!
For sale
$114,900
419 S Warren St, Pinconning, MI 48650
2beds
780sqft
Single Family Residence
Built in 1946
3,920 Square Feet Lot
$114,400 Zestimate®
$147/sqft
$-- HOA
What's special
- 9 days
- 303
- 23
Zillow last checked:
Listed by:
Rebecca Weller 586-596-8554,
Hagle Real Estate, LLC 855-738-1210
Source: RMLS Multi-List,MLS#: 799-26-0073
Facts & features
Interior
Bedrooms & bathrooms
- Bedrooms: 2
- Bathrooms: 1
- Full bathrooms: 1
Heating
- Forced Air
Cooling
- None
Features
- Basement: Yes
Interior area
- Total structure area: 780
- Total interior livable area: 780 sqft
Property
Parking
- Total spaces: 1
- Parking features: GarageDetached
- Has garage: Yes
Lot
- Size: 3,920 Square Feet
Details
- Parcel number: 180P0500301000
Construction
Type & style
- Home type: SingleFamily
- Property subtype: Single Family Residence
Condition
- Year built: 1946
Community & HOA
Location
- Region: Pinconning
Financial & listing details
- Price per square foot: $147/sqft
- Tax assessed value: $58,800
- Annual tax amount: $1,341
- Date on market: 11/11/2026
- Lease term: Contact For Details
Estimated market value
$114,400
$109,000 - $120,000
$1,004/mo
Price history
| Date | Event | Price |
|---|---|---|
| 11/19/2026 | Price change | $950-2.6%$1/sqft |
Source: Zillow Rentals Report a problem | ||
| 11/11/2026 | Listed for sale | $114,900+35.2%$147/sqft |
Source:  RMLS Multi-List #799-26-0073 Report a problem | ||
| 11/6/2026 | Price change | $975-1.5%$1/sqft |
Source: Zillow Rentals Report a problem | ||
| 10/4/2026 | Listed for rent | $990$1/sqft |
Source: Zillow Rentals Report a problem | ||
| 8/13/2026 | Sold | $85,000-10.5%$109/sqft |
Source:  Realcomp II #61050213585 Report a problem | ||
| 7/6/2026 | Pending sale | $95,000$122/sqft |
Source:  MIDMLS #50213586 Report a problem | ||
| 7/2/2026 | Listed for sale | $95,000+91.9%$122/sqft |
Source:  MiRealSource #50213585 Report a problem | ||
| 12/9/2010 | Sold | $49,500$63/sqft |
Source: Public Record Report a problem | ||
Public tax history
| Year | Property taxes | Tax assessment |
|---|---|---|
| 2025 | $1,341 -4.5% | $29,400 +5% |
| 2024 | $1,404 +14.5% | $28,000 +20.2% |
| 2023 | $1,227 +6.9% | $23,300 -2.1% |
| 2022 | $1,148 +9.6% | $23,800 +4.4% |
| 2021 | $1,048 +4.6% | $22,800 +15.2% |
| 2020 | $1,002 -1.8% | $19,800 +4.2% |
| 2019 | $1,020 | $19,000 -3.1% |
| 2018 | $1,020 +2.3% | $19,600 +1% |
| 2017 | $997 | $19,400 +1.6% |
| 2016 | $997 | $19,100 -7.3% |
| 2015 | $997 | $20,600 -10.8% |
| 2014 | -- | $23,100 +5% |
| 2013 | -- | $22,000 -13.4% |
| 2012 | -- | $25,400 +14.4% |
| 2011 | -- | $22,200 -13.6% |
| 2010 | -- | $25,700 -3.7% |
| 2009 | -- | $26,700 +0.4% |
| 2008 | -- | $26,600 -4% |
| 2007 | -- | $27,700 -2.1% |
| 2006 | -- | $28,300 +2.5% |
| 2005 | -- | $27,600 +0.7% |
| 2004 | -- | $27,400 +3% |
| 2003 | -- | $26,600 +2.7% |
| 2002 | -- | $25,900 +10.7% |
| 2001 | -- | $23,400 |
Find assessor info on the county website
Monthly payment
Est. payment
Payment breakdown
Explore the cost of this home by adjusting the details. Changes won't be saved.Climate risks
Neighborhood: 48650
Similar homes
- $85,0002 bd1 ba672 sqft111 E 6th St, Pinconning, MI 48650For Sale
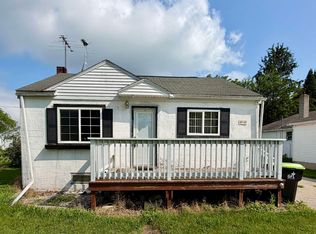
 MLS ID #50217843, Tonya Thrailkill, Bays Edge Real Estate. MiRealSource
- $84,9993 bd1 ba1.1k sqft219 N Jackson St, Bay City, MI 48708For Sale
 MLS ID #50227906, Kelti Holbrook, HOMEFLO. MiRealSource
- $112,0003 bd1 ba1k sqft3606 Angus St, Standish, MI 48658For Sale
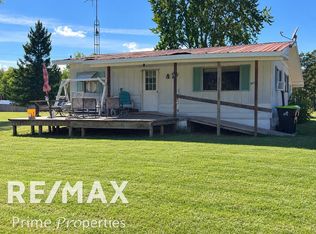 MLS ID #50221360, Todd Richards, REMAX Prime Properties. MiRealSource
- $99,9002 bd1 ba708 sqft2157 Ash St, Standish, MI 48658For Sale
 MLS ID #1947841, KAREN WILTSE. NGLRMLS
- $115,0002 bd1 ba1k sqft607 N Sophia St, Bay City, MI 48706For SaleMLS ID #50221686, Thomas Ciaciuch, Bay Valley Realty. MiRealSource
- $139,9003 bd1 ba1.1k sqft277 N Elevator Rd, Linwood, MI 48634For SaleMLS ID #50221156, Linda L Anderson, Bay Area Real Estate. MiRealSource
- $115,9003 bd1 ba976 sqft508.5 N Catherine St, Bay City, MI 48706For SaleMLS ID #50221882, Diana Smith, Berkshire Hathaway HomeServices. MiRealSource
- $121,9003 bd1 ba1k sqft1105 Langstaff St, Essexville, MI 48732For SaleMLS ID #50214548, Christopher Craves, Gold Pine Real Estate. MiRealSource
- $139,9003 bd1 ba1k sqft39 Spruce Ridge Rd, Bay City, MI 48706For SaleMLS ID #50226300, Abigail Miller, JPAR - Great Lakes Bay Region. MiRealSource
- $117,5003 bd2 ba1.1k sqft301 S Catherine St, Bay City, MI 48706For SaleMLS ID #50219935, Chanel DuBois, Berkshire Hathaway HomeServices, Bay City. MiRealSource
- $127,0002 bd1 ba801 sqft1337 N Johnson St, Bay City, MI 48708For SaleMLS ID #50225311, Cesar Ortega, Ayre/Rhinehart Bay REALTORS. MiRealSource
- $136,5002 bd1 ba976 sqft1361 Elm Blvd, Beaverton, MI 48612For SaleMLS ID #50219820, KERRY REDMAN, RE/MAX RIVER HAVEN. MiRealSource
- $120,0002 bd1 ba1k sqft1012 Litchfield St, Bay City, MI 48706For Sale
 MLS ID #26039291, Benjamin Ewing, Ewing Realty LLC. MichRIC
- $105,0002 bd1 ba1.1k sqft307 King St, Bay City, MI 48706For SaleMLS ID #50217253, William Jaynes, RE/MAX Results. MiRealSource
- $100,0002 bd1 ba928 sqft1137 Pinetree St, Beaverton, MI 48612For Sale
 MLS ID #50218555, Dan Reimer, RE/MAX of Midland. MIDMLS
- $99,9003 bd1 ba1.1k sqft1003 N Linn St, Bay City, MI 48706For SaleMLS ID #50223858, Carter A Musselman, Berkshire Hathaway HomeServices, Bay City. MiRealSource
