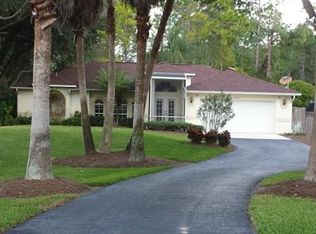
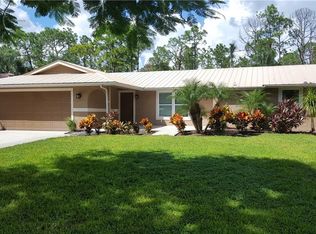
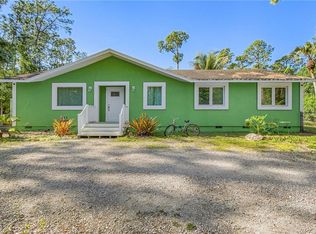
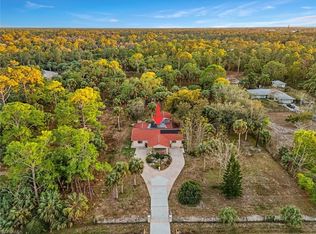
This is a 2302 square foot, single family home. This home is located at 4191 11th Ave SW, Naples, FL 34116.
Pre-foreclosure
Street View
Est. $769,300
4191 11th Ave SW, Naples, FL 34116
--beds
--baths
2,302sqft
SingleFamily
Built in 1993
2.73 Acres Lot
$769,300 Zestimate®
$334/sqft
$-- HOA
Overview
- 320 days |
- 20 |
- 1 |
Facts & features
Interior
Interior area
- Total interior livable area: 2,302 sqft
Property
Parking
- Parking features: Garage - Attached
Lot
- Size: 2.73 Acres
Details
- Parcel number: 37929040004
Construction
Type & style
- Home type: SingleFamily
Condition
- Year built: 1993
Community & HOA
Location
- Region: Naples
Financial & listing details
- Price per square foot: $334/sqft
- Tax assessed value: $712,939
- Annual tax amount: $7,203
Visit our professional directory to find a foreclosure specialist in your area that can help with your home search.
Find a foreclosure agentForeclosure details
Estimated market value
$769,300
$685,000 - $854,000
$3,531/mo
Price history
| Date | Event | Price |
|---|---|---|
| 4/6/2002 | Sold | $302,000+14%$131/sqft |
Source: Public Record Report a problem | ||
| 9/4/2001 | Sold | $264,900$115/sqft |
Source: Public Record Report a problem | ||
Public tax history
| Year | Property taxes | Tax assessment |
|---|---|---|
| 2025 | $7,203 +1.4% | $607,124 +10% |
| 2024 | $7,106 +12.4% | $551,931 +10% |
| 2023 | $6,321 +5.5% | $501,755 +10% |
| 2022 | $5,992 +24.5% | $456,141 +10% |
| 2021 | $4,812 +113% | $414,674 +76% |
| 2020 | $2,259 +2% | $235,598 +2.3% |
| 2019 | $2,214 +2.5% | $230,301 +1.9% |
| 2018 | $2,160 -9% | $226,007 +2.1% |
| 2017 | $2,374 +1.8% | $221,358 +2.1% |
| 2016 | $2,331 +2.6% | $216,805 +0.7% |
| 2015 | $2,271 -0.6% | $215,298 +31.6% |
| 2014 | $2,286 +9.5% | $163,589 +2% |
| 2013 | $2,087 +1% | $160,433 +2.2% |
| 2012 | $2,067 +4.3% | $156,915 +4% |
| 2011 | $1,982 -37% | $150,888 -34.3% |
| 2010 | $3,145 +9.1% | $229,507 -9.9% |
| 2009 | $2,884 | $254,844 -16.3% |
| 2008 | $2,884 -9.7% | $304,539 +3% |
| 2007 | $3,193 -3.2% | $295,669 +2.5% |
| 2006 | $3,299 | $288,458 +3% |
| 2005 | $3,299 +2.4% | $280,056 +3% |
| 2004 | $3,221 -0.5% | $271,899 +1.9% |
| 2003 | $3,237 +3.6% | $266,829 +16% |
| 2002 | $3,125 -10.8% | $229,991 +53.2% |
| 2001 | $3,503 +103.2% | $150,109 |
| 2000 | $1,724 | -- |
Find assessor info on the county website
Monthly payment
Estimated monthly payment$1,822
All calculations are estimates and provided by Zillow, Inc. for informational purposes only. Actual amounts may vary.
HOA fees may include property taxes on listings classified as Co-Ops. Contact the listing agent and/or owner for fee details.
Mortgage interest rates are dependent on a number of factors, including credit score, down payment, and repayment length. Interest rate data provided by Zillow Group Marketplace, Inc. as of 1/1/1970 from various mortgage lenders with which we have lead or other similar arrangements; the Estimated Payment is an average of those rates.
See how much you could borrow to make a competitive offer.
Climate risks
Neighborhood: Golden Gate
Nearby schools
GreatSchools rating
- 9/10Vineyards Elementary SchoolGrades: PK-5Distance: 3.4 mi
- 10/10Oakridge Middle SchoolGrades: 6-8Distance: 3.8 mi
- 4/10Golden Gate High SchoolGrades: PK,9-12Distance: 3 mi


- Florida
- Collier County
- Naples
- 34116
- Golden Gate
- 4191 11th Ave SW
Nearby cities
Nearby neighborhoods
Nearby zip codes
Other Naples Topics
