JUST REDUCED.. CUTE SINGLE STORY HOME WITH A BACK DECK VIEW AND THE GREAT TEMECULA BREEZE! Carpet and paint will do this place wonders. QUIET NEIGHBORHOOD, CLOSE TO SCHOOLS AND SHOPPING. BANK OWNED
Pre-foreclosure
Street View
Est. $663,700
43129 Vista Del Rancho, Temecula, CA 92592
3beds
2baths
2,010sqft
SingleFamily
Built in 1987
8,276 Square Feet Lot
$663,700 Zestimate®
$330/sqft
$-- HOA
Overview
- 21 days
- 12
- 1
Facts & features
Interior
Bedrooms & bathrooms
- Bedrooms: 3
- Bathrooms: 2
Heating
- Other
Cooling
- Central
Features
- Has fireplace: Yes
Interior area
- Total interior livable area: 2,010 sqft
Property
Parking
- Parking features: Garage - Attached
Lot
- Size: 8,276 Square Feet
Details
- Parcel number: 945271017
Construction
Type & style
- Home type: SingleFamily
Materials
- wood frame
- Roof: Tile
Condition
- Year built: 1987
Community & HOA
Location
- Region: Temecula
Financial & listing details
- Price per square foot: $330/sqft
- Tax assessed value: $334,926
Foreclosure details
Estimated market value
$663,700
$624,000 - $697,000
$3,223/mo
Price history
| Date | Event | Price |
|---|---|---|
| 3/30/2009 | Sold | $255,000+2%$127/sqft |
Source: Public Record Report a problem | ||
| 1/3/2009 | Price change | $249,900-9.1%$124/sqft |
Source: SecondSpace #20603936 Report a problem | ||
| 11/23/2008 | Listed for sale | $274,900-6%$137/sqft |
Source: SecondSpace #20603936 Report a problem | ||
| 10/21/2008 | Sold | $292,500-32%$146/sqft |
Source: Public Record Report a problem | ||
| 9/3/2004 | Sold | $430,000$214/sqft |
Source: Public Record Report a problem | ||
Public tax history
| Year | Property taxes | Tax assessment |
|---|---|---|
| 2026 | -- | $334,926 +2% |
| 2025 | $4,053 +1.6% | $328,360 +2% |
| 2024 | $3,991 +0.9% | $321,922 +2% |
| 2023 | $3,955 +2.5% | $315,611 +2% |
| 2022 | $3,860 +2.3% | $309,424 +2% |
| 2021 | $3,774 +1.2% | $303,358 +1% |
| 2020 | $3,730 +1.6% | $300,249 +2% |
| 2019 | $3,673 +2.1% | $294,362 +2% |
| 2018 | $3,597 +1.9% | $288,591 +2% |
| 2017 | $3,529 | $282,933 +2% |
| 2016 | $3,529 +3.9% | $277,387 +1.5% |
| 2015 | $3,397 +3.2% | $273,222 +2% |
| 2014 | $3,292 | $267,872 +0.5% |
| 2013 | -- | $266,662 +2% |
| 2012 | -- | $261,434 +12.2% |
| 2011 | -- | $233,000 -8.4% |
| 2010 | -- | $254,395 -3.3% |
| 2009 | -- | $263,000 -28.9% |
| 2008 | -- | $370,000 -17.3% |
| 2007 | -- | $447,372 +2% |
| 2006 | -- | $438,600 +2% |
| 2005 | -- | $430,000 +137.5% |
| 2003 | -- | $181,030 +2% |
| 2002 | -- | $177,481 +2% |
| 2001 | $2,212 -0.3% | $174,002 +2% |
| 2000 | $2,218 | $170,591 |
Find assessor info on the county website
Monthly payment
Climate risks
Neighborhood: 92592
- $657,7003 bd3 ba1.8k sqft43145 Vista Del Rancho, Temecula, CA 92592Off Market
- $704,9003 bd3 ba2.1k sqft43113 Vista Del Rancho, Temecula, CA 92592Off Market

- $741,7003 bd3 ba2k sqft43161 Vista Del Rancho, Temecula, CA 92592Off Market
- $654,1003 bd2 ba1.8k sqft43097 Vista Del Rancho, Temecula, CA 92592Off Market
Similar homes
- $674,0004 bd3 ba1.5k sqft32000 Corte Cardin, Temecula, CA 92592For Sale
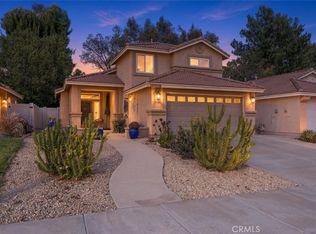 MLS ID #SW26241391, Jacqueline Steed, Jackie Steed, Broker. CRMLS
- $659,0003 bd3 ba1.3k sqft31831 Corte Priego, Temecula, CA 92592For Sale
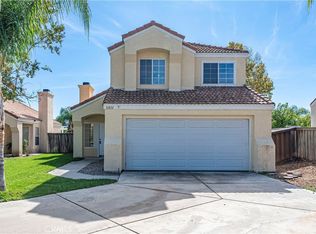 MLS ID #PW26239224, Kevin Lee, T.N.G. Real Estate Consultants. CRMLS
- $699,9993 bd2 ba1.4k sqft30090 Levande Pl, Temecula, CA 92592For Sale
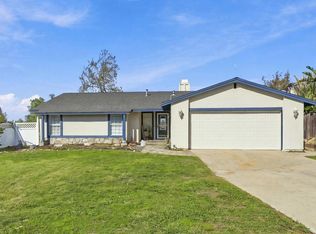 MLS ID #NDP2610028, Ciara Yerkey, ROA California Inc.. CRMLS
- $599,9993 bd2 ba1.5k sqft41664 Avenida De La Reina, Temecula, CA 92592For Sale
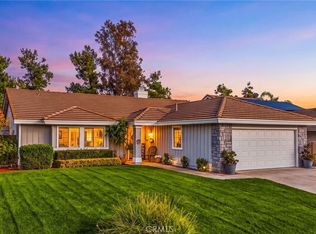 MLS ID #SW26244694, Tyson Robinson, Trillion Real Estate. CRMLS
