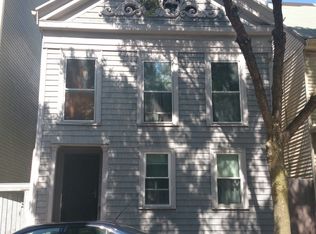
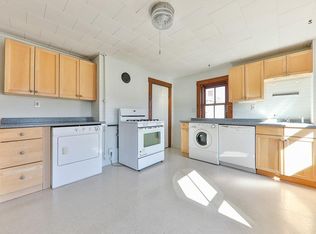
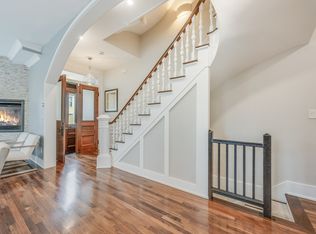
West side 3 Family, situated in the hottest area in South Boston.This flood square, Victorian is located a quiet street. Only blocks from T stops and yards from bus stops. Grand entrance hall and impressive spiral staircase provides access to 3 units to create great income. Units are leased through 9/1/27. 24 hour notice for all showings.
For sale
$1,725,000
438 W 4th St, South Boston, MA 02127
5beds
2,796sqft
3 Family - 3 Units Up/Down
Built in 1890
-- sqft lot
$1,671,900 Zestimate®
$617/sqft
$-- HOA
What's special
Quiet streetGrand entrance hallImpressive spiral staircase
- 1 day
- 144
- 7
Zillow last checked:
Listing updated:
Listed by:
Elizabeth Derenzo 617-721-7680,
J. Derenzo & Associates, LLC 781-449-0300
Source: MLS PIN,MLS#: 73602033
Facts & features
Interior
Bedrooms & bathrooms
- Bedrooms: 5
- Bathrooms: 3
- Full bathrooms: 3
Heating
- Hot Water, Natural Gas
Cooling
- None
Appliances
- Included: Range, Refrigerator, Dishwasher
Features
- Bathroom With Tub, Ceiling Fan(s), Living Room, Kitchen, Office/Den
- Flooring: Wood
- Basement: Unfinished
- Number of fireplaces: 5
Interior area
- Total structure area: 2,796
- Total interior livable area: 2,796 sqft
- Finished area above ground: 2,796
Property
Lot
- Size: 1,672 Square Feet
- Features: Zero Lot Line
Details
- Parcel number: 1412447
- Zoning: 0105
Construction
Type & style
- Home type: MultiFamily
- Property subtype: 3 Family - 3 Units Up/Down
Materials
- Frame
- Foundation: Granite
Condition
- Year built: 1890
Utilities & green energy
- Electric: 110 Volts
- Sewer: Public Sewer
- Water: Public
Community & HOA
Location
- Region: South Boston
Financial & listing details
- Price per square foot: $617/sqft
- Tax assessed value: $1,650,000
- Annual tax amount: $10,230
- Date on market: 11/13/2026
- Total actual rent: 8975
Estimated market value
$1,671,900
$1.52M - $1.84M
$5,568/mo
Price history
| Date | Event | Price |
|---|---|---|
| 11/13/2026 | Listed for sale | $1,725,000+44.4%$617/sqft |
Source: MLS PIN #73602033 Report a problem | ||
| 5/8/2018 | Sold | $1,195,000+0.7%$427/sqft |
Source: Public Record Report a problem | ||
| 4/5/2018 | Listed for sale | $1,187,000+416.1%$425/sqft |
Source: Keating Brokerage #72303586 Report a problem | ||
| 9/21/1999 | Sold | $230,000+79.7%$82/sqft |
Source: LINK #27571 Report a problem | ||
| 2/28/1997 | Sold | $128,000$46/sqft |
Source: Public Record Report a problem | ||
Public tax history
| Year | Property taxes | Tax assessment |
|---|---|---|
| 2025 | $19,107 +8.7% | $1,650,000 +2.3% |
| 2024 | $17,577 +5.5% | $1,612,600 +4% |
| 2023 | $16,655 +10.6% | $1,550,700 +12% |
| 2022 | $15,063 +7.1% | $1,384,500 +5% |
| 2021 | $14,069 +22% | $1,318,600 +20.7% |
| 2020 | $11,534 +10.2% | $1,092,200 +10% |
| 2019 | $10,467 +7.7% | $993,100 +7% |
| 2018 | $9,723 +360.3% | $927,800 +5% |
| 2017 | $2,112 -75% | $883,300 +15% |
| 2016 | $8,449 +21% | $768,100 +33.3% |
| 2015 | $6,980 +17.6% | $576,400 +27.6% |
| 2013 | $5,935 +10.3% | $451,700 +9.5% |
| 2012 | $5,379 +2% | $412,500 |
| 2011 | $5,276 +6.6% | $412,500 -1% |
| 2010 | $4,949 -1.3% | $416,600 -11.7% |
| 2009 | $5,013 -9.8% | $471,600 -6.9% |
| 2008 | $5,560 -0.2% | $506,800 -0.1% |
| 2007 | $5,573 | $507,100 |
Find assessor info on the county website
Monthly payment
Est. payment
Payment breakdown
Explore the cost of this home by adjusting the details. Changes won't be saved.Climate risks
Neighborhood: South Boston


Similar homes
- $1,699,0003 bd4 ba2k sqft39 G St, South Boston, MA 02127For Sale
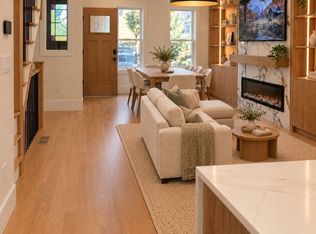 MLS ID #73602154, Hitesh Tara, eXp Realty LLC - Corporate Office. MLS PIN
- $1,699,0006 bd4 ba2.8k sqft570 E Broadway, Boston, MA 02127For Sale
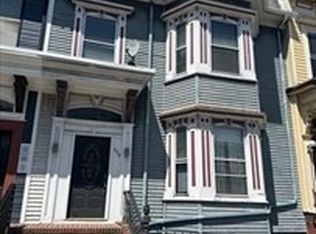 MLS ID #73586069, Lanie Donlan, Real Mont RE. MLS PIN
- $1,649,0005 bd4 ba3.2k sqft118 F St, South Boston, MA 02127For Sale
 MLS ID #73527062, David Winick, Cosmopolitan Realty Advisors. MLS PIN
- $1,925,0004 bd3 ba2.3k sqft129 I St, South Boston, MA 02127For Sale
 MLS ID #73600252, Carlisle Group, Compass. MLS PIN
