INVESTOR SPECIAL* FIRE DAMAGE* home in GENTRY ESTATES. Needs FULL GUT REMODEL/ ROOF as well as about 25-30% of the outside siding and deck. Priced to sell in one of the most desired neighborhoods in the city. Selling AS-IS. Serious inquiries only please call 202-578-8618 thanks
For sale by owner
$150,000
4416 E Clayton Ct, Bloomington, IN 47401
3beds
1,440sqft
SingleFamily
Built in 1991
3,760 Square Feet Lot
$319,800 Zestimate®
$104/sqft
$25/mo HOA
Overview
What the owner loves about this home
Neighborhood/ location/ resale value/ low hoa dues and a pool/ playground just a few hundred steps away
- 5 days
- 540
- 13
Listed by:
Property Owner (202) 578-8618
Facts & features
Interior
Bedrooms & bathrooms
- Bedrooms: 3
- Bathrooms: 2
- Full bathrooms: 2
Heating
- Other
Cooling
- Central
Features
- Basement: None
Interior area
- Total interior livable area: 1,440 sqft
Property
Parking
- Parking features: Garage - Attached
Lot
- Size: 3,760 Square Feet
Details
- Parcel number: 530801303026000009
Construction
Type & style
- Home type: SingleFamily
Materials
- masonry
- Foundation: Crawl/Raised
- Roof: Asphalt
Condition
- New construction: No
- Year built: 1991
Community & HOA
HOA
- Has HOA: Yes
- HOA fee: $25 monthly
Location
- Region: Bloomington
Financial & listing details
- Price per square foot: $104/sqft
- Tax assessed value: $313,500
- Annual tax amount: $3,025
- Date on market: 11/5/2026
Estimated market value
$319,800
$297,000 - $339,000
$2,086/mo
Price history
| Date | Event | Price |
|---|---|---|
| 11/5/2026 | Listed for sale | $150,000$104/sqft |
Source: Owner Report a problem | ||
Public tax history
| Year | Property taxes | Tax assessment |
|---|---|---|
| 2025 | $3,025 +2.2% | $313,500 +0.9% |
| 2024 | $2,960 +15.8% | $310,800 +0.7% |
| 2023 | $2,555 +19.8% | $308,600 +14.7% |
| 2022 | $2,133 +11.1% | $269,100 +15.9% |
| 2021 | $1,920 +11.9% | $232,200 +7% |
| 2020 | $1,716 -25.7% | $217,100 +9.4% |
| 2019 | $2,308 +57% | $198,500 +7.8% |
| 2018 | $1,470 +10.2% | $184,100 +2.8% |
| 2017 | $1,333 | $179,100 +3.3% |
| 2016 | $1,333 +6.7% | $173,300 +5.3% |
| 2014 | $1,250 +31.5% | $164,600 +5% |
| 2013 | $951 +2% | $156,800 +2% |
| 2012 | $932 +2% | $153,700 -3.9% |
| 2011 | $914 +2% | $160,000 +1.8% |
| 2010 | $896 +2% | $157,100 +1.6% |
| 2009 | $878 -7.8% | $154,600 +4% |
| 2007 | $953 | $148,600 +4.6% |
| 2006 | -- | $142,000 +15.4% |
| 2005 | -- | $123,100 |
Find assessor info on the county website
Monthly payment
Est. payment
Payment breakdown
Explore the cost of this home by adjusting the details. Changes won't be saved.Climate risks
Neighborhood: 47401
- $240,0003 bd3 ba1.2k sqft3477 S Oaklawn Cir, Bloomington, IN 47401For Sale By Owner

- $143,4006 acres3900 S Swartz Ridge Rd, BLOOMINGTON, IN 47401Off Market

- $309,2003 bd2 ba1.7k sqft9110 S Greenridge Ln, Bloomington, IN 47401Off Market

- $--1 bd1 ba7.1k sqft7055 E State Ct #45, Bloomington, IN 47401Off Market

Similar homes
- $135,0002 bd1 ba864 sqft5375 S Fairfax Rd, Bloomington, IN 47401For Sale
 MLS ID #202646168, Janet Lane, Century 21 Scheetz - Bloomington. IRMLS
- $129,7773 bd2 ba960 sqft7046 S Shields Ridge Rd, Bloomington, IN 47401For Sale
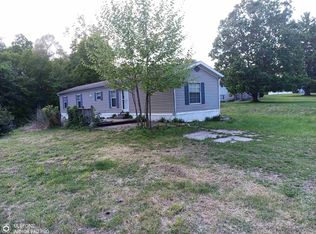 MLS ID #202616994, Alex Gul, Alex Gul Real Estate. IRMLS
- $149,9003 bd2 ba1.1k sqft8767 S Gore Rd, Bloomington, IN 47403For Sale
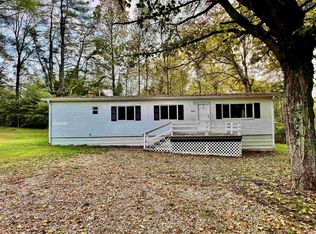 MLS ID #202645008, Juan Carlos Carrasquel CCIM, The JuanSells.com Realty Co. IRMLS
- $175,0002 bd1 ba800 sqft5601 S Handy Rd, Bloomington, IN 47401For Sale
 MLS ID #202640211, Edward Buthelezi, Carpenter, REALTORS-Bloomington. IRMLS
