Opportunity awaits with this three-family property in New Bedford! Offering two spacious 3-bedroom units and one 2-bedroom unit, each with one full bathroom, this property presents an excellent opportunity for investors or owner-occupants looking to build equity. The second and third floor units will be delivered vacant at closing, providing flexibility for renovations, occupancy, or securing new tenants at market rents. On-street parking only. Bring your vision and make the most of this investment opportunity!
For sale
$480,000
45 Pierce St, New Bedford, MA 02740
8beds
2,558sqft
3 Family
Built in 1897
-- sqft lot
$478,500 Zestimate®
$188/sqft
$-- HOA
What's special
- 9 days
- 1,097
- 108
Likely to sell faster than
Zillow last checked:
Listing updated:
Listed by:
Josiah Cordero 774-992-9766,
RE/MAX Vantage 774-992-0297,
Quinn DeMelo 508-558-9027
Source: MLS PIN,MLS#: 73590146
Facts & features
Interior
Bedrooms & bathrooms
- Bedrooms: 8
- Bathrooms: 3
- Full bathrooms: 3
Features
- Basement: Full,Unfinished
- Has fireplace: No
Interior area
- Total structure area: 2,558
- Total interior livable area: 2,558 sqft
- Finished area above ground: 2,558
Property
Lot
- Size: 2,566 Square Feet
- Features: Level
Details
- Parcel number: M:0051 L:0326,2891700
- Zoning: RB
Construction
Type & style
- Home type: MultiFamily
- Property subtype: 3 Family
Materials
- Foundation: Irregular
Condition
- Year built: 1897
Utilities & green energy
- Sewer: Public Sewer
- Water: Public
Community & HOA
Community
- Features: Public Transportation, Shopping
Location
- Region: New Bedford
Financial & listing details
- Price per square foot: $188/sqft
- Tax assessed value: $443,700
- Annual tax amount: $5,018
- Date on market: 10/13/2026
- Total actual rent: 0
Estimated market value
$478,500
$455,000 - $502,000
$2,008/mo
Price history
| Date | Event | Price |
|---|---|---|
| 10/13/2026 | Listed for sale | $480,000+182.4%$188/sqft |
Source: MLS PIN #73590146 Report a problem | ||
| 1/7/2008 | Sold | $170,000-36.7%$66/sqft |
Source: Public Record Report a problem | ||
| 8/21/2007 | Sold | $268,592-4%$105/sqft |
Source: Public Record Report a problem | ||
| 6/16/2004 | Sold | $279,900+62.3%$109/sqft |
Source: Public Record Report a problem | ||
| 10/29/2003 | Sold | $172,500$67/sqft |
Source: Public Record Report a problem | ||
Public tax history
| Year | Property taxes | Tax assessment |
|---|---|---|
| 2025 | $5,018 +15.8% | $443,700 +22.9% |
| 2024 | $4,332 +11.8% | $361,000 +33.1% |
| 2023 | $3,875 +12.1% | $271,200 +21.9% |
| 2022 | $3,456 +3.6% | $222,400 +4% |
| 2021 | $3,335 +0.9% | $213,900 +4.6% |
| 2020 | $3,305 +14.4% | $204,500 +16.5% |
| 2019 | $2,890 +4.6% | $175,500 +5.6% |
| 2018 | $2,764 +8.3% | $166,200 +8.7% |
| 2017 | $2,552 +4.9% | $152,900 +3.7% |
| 2016 | $2,432 +7% | $147,500 +2.1% |
| 2015 | $2,273 +4.9% | $144,500 +1.1% |
| 2014 | $2,166 -3.9% | $142,900 -9.2% |
| 2013 | $2,254 -1% | $157,300 -4.9% |
| 2012 | $2,276 -7.9% | $165,400 -13.8% |
| 2011 | $2,472 -6.7% | $191,900 -12.9% |
| 2010 | $2,650 -0.6% | $220,300 -5.4% |
| 2009 | $2,666 +6.5% | $232,800 -1.9% |
| 2008 | $2,504 -10.9% | $237,300 -12.9% |
| 2007 | $2,809 +2.9% | $272,500 +8.5% |
| 2006 | $2,729 +6.4% | $251,100 +11.3% |
| 2005 | $2,565 +17.7% | $225,600 +28% |
| 2004 | $2,180 +57.7% | $176,200 +86.9% |
| 2003 | $1,382 +13.7% | $94,300 +19.5% |
| 2002 | $1,216 -9.5% | $78,900 -4.7% |
| 2000 | $1,344 +19% | $82,800 -2.7% |
| 1996 | $1,129 | $85,100 |
Find assessor info on the county website
Monthly payment
Est. payment
Payment breakdown
Explore the cost of this home by adjusting the details. Changes won't be saved.Climate risks
Neighborhood: 02740
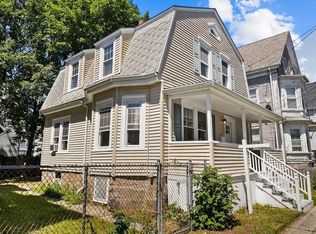
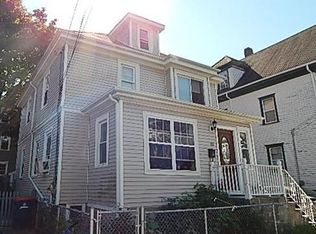
Similar homes
- $529,9007 bd2 ba2.4k sqft27 Willow St #29, New Bedford, MA 02740For Sale
 MLS ID #73592896, Jenna Danielli, LPT Realty - Home & Key Group. MLS PIN
- $--9 bd3 ba3.1k sqft158 Thompson St, New Bedford, MA 02740Auction
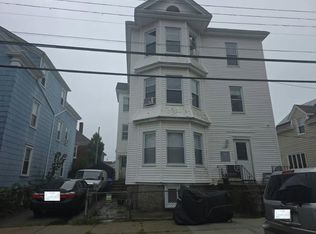 Auction.com 2
- $459,0009 bd4 ba2.2k sqft32 Franklin St, New Bedford, MA 02740For Sale
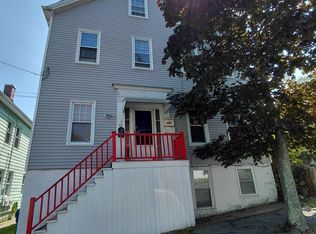 MLS ID #73568118, Jane Kalife Paul, Conway - Mattapoisett. MLS PIN
- $475,0006 bd3 ba1.8k sqft1272 Pleasant St, New Bedford, MA 02740For Sale
 MLS ID #73548845, Josiah Cordero, RE/MAX Vantage. MLS PIN
