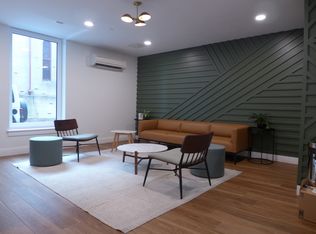
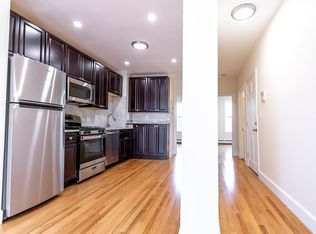
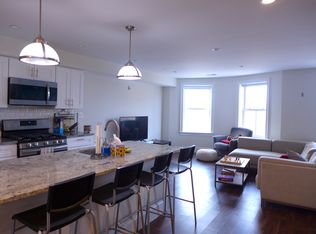
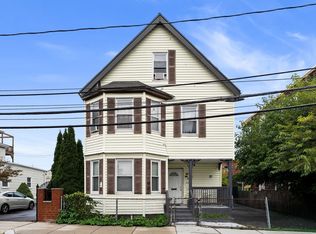
RARE BELOW MARKET OPPORTUNITY with significant equity and cash flow upside in coming years. Renovated 3 family brick row house in Boston's desirable South End zip code of 02118, including a total of 8 bedrooms, 3 bathrooms and a total of 3,504sqft. All 3 units are rented with high performing leases. Detailed rent roll and full 2025/2026 P&L available upon request. Unit 1: 2 bedroom, 1 bath - $2,278/month (80% AMI), Unit 2: 3 bedroom, 1 bath - $1,948/month (60% AMI), Unit 3: 3 bedroom, 1 bath - $2,500/month (80% AMI). No BPDA restrictions on the sale or buyer qualifications. Rent limit restrictions (AMI percentages above) will expire in 2038, unlocking full market value rents. Full deed restriction details, including title insurance verification of 2038 expiration available upon request. Currently offered at a cap rate of ~5, with substantial upside in future years, as AMI limits increase and with the eventual expiration of deed restriction in 2038. Recent improvements include: full lead paint compliance/certification, plumbing, new indirect water heaters (2), refurbished gas boiler systems (3), reinforced masonry - basement and exterior. Completely renovated entranceway, including new front stairs, new front door and digital locking system, new entranceway paneling and lighting. New appliances (unit 1 stove and unit 2 fridge)
For sale
$1,299,999
45 Thorndike St, Roxbury, MA 02118
8beds
2,628sqft
3 Family - 3 Units Up/Down
Built in 1900
-- sqft lot
$797,500 Zestimate®
$495/sqft
$-- HOA
What's special
Digital locking systemBrick row houseNew indirect water heatersCompletely renovated entrancewayNew front stairs
- 3 days
- 231
- 10
Likely to sell faster than
Zillow last checked:
Listing updated:
Listed by:
Jason G. Mahoney Esq. 617-839-2093,
Vitruvius Realty 617-839-2093,
Jason G. Mahoney Esq. 617-839-2093
Source: MLS PIN,MLS#: 73594957
Facts & features
Interior
Bedrooms & bathrooms
- Bedrooms: 8
- Bathrooms: 3
- Full bathrooms: 3
Features
- Basement: Full,Walk-Out Access,Unfinished
- Has fireplace: No
Interior area
- Total structure area: 2,628
- Total interior livable area: 2,628 sqft
- Finished area above ground: 2,628
Property
Features
- Fencing: Fenced/Enclosed
Lot
- Size: 1,100 Square Feet
- Features: Level
Details
- Parcel number: 3392281
- Zoning: RES
Construction
Type & style
- Home type: MultiFamily
- Property subtype: 3 Family - 3 Units Up/Down
Materials
- Foundation: Brick/Mortar
Condition
- Year built: 1900
Utilities & green energy
- Sewer: Public Sewer
- Water: Public
Community & HOA
Location
- Region: Roxbury
Financial & listing details
- Price per square foot: $495/sqft
- Tax assessed value: $811,400
- Annual tax amount: $10,149
- Date on market: 10/26/2026
- Total actual rent: 6726
Estimated market value
$797,500
$726,000 - $869,000
$4,828/mo
Price history
| Date | Event | Price |
|---|---|---|
| 10/26/2026 | Listed for sale | $1,299,999+60.2%$495/sqft |
Source: MLS PIN #73594957 Report a problem | ||
| 1/24/2025 | Sold | $811,400-14.6%$309/sqft |
Source: MLS PIN #73306187 Report a problem | ||
| 11/21/2024 | Contingent | $950,000$361/sqft |
Source: MLS PIN #73306187 Report a problem | ||
| 11/12/2024 | Price change | $950,000-20.8%$361/sqft |
Source: MLS PIN #73306187 Report a problem | ||
| 10/24/2024 | Listed for sale | $1,200,000+485.4%$457/sqft |
Source: MLS PIN #73306187 Report a problem | ||
| 12/28/2010 | Sold | $205,000-16.3%$78/sqft |
Source: Public Record Report a problem | ||
| 8/23/2006 | Sold | $245,000+7105.9%$93/sqft |
Source: Public Record Report a problem | ||
| 1/16/1992 | Sold | $3,400$1/sqft |
Source: Public Record Report a problem | ||
Public tax history
| Year | Property taxes | Tax assessment |
|---|---|---|
| 2025 | $4,263 +11.5% | $368,100 +5% |
| 2024 | $3,822 +6.6% | $350,600 +5% |
| 2023 | $3,586 +3.6% | $333,900 +5% |
| 2022 | $3,460 +7.1% | $318,000 +5% |
| 2021 | $3,232 +6.1% | $302,900 +5% |
| 2020 | $3,047 +5.2% | $288,500 +5% |
| 2019 | $2,896 +5.6% | $274,800 +5% |
| 2018 | $2,743 +320.3% | $261,700 +5% |
| 2017 | $653 -75% | $249,200 +5% |
| 2016 | $2,610 -4.6% | $237,300 +5% |
| 2015 | $2,737 +1.6% | $226,000 +10.2% |
| 2013 | $2,694 -30.7% | $205,000 -31.2% |
| 2012 | $3,885 +2% | $297,900 |
| 2011 | $3,810 +6.6% | $297,900 -1% |
| 2010 | $3,575 -2.3% | $300,900 -12.6% |
| 2009 | $3,661 -17.4% | $344,400 -14.7% |
| 2008 | $4,430 -2.9% | $403,800 -2.7% |
| 2007 | $4,561 | $415,000 |
Find assessor info on the county website
Monthly payment
Est. payment
Payment breakdown
Explore the cost of this home by adjusting the details. Changes won't be saved.Climate risks
Neighborhood: Roxbury
Similar homes
- $1,250,0006 bd4 ba3.1k sqft4 Kearsarge Ave, Roxbury, MA 02119For Sale
 MLS ID #73590969, Kevin Benzinger, Boston Realty Advisors. MLS PIN
- $1,250,0009 bd4 ba2.6k sqft121 George St, Roxbury, MA 02119For Sale
 MLS ID #73558751, Phaedra Udor, MIG. MLS PIN
- $1,190,0007 bd3 ba2.6k sqft161 Westville St, Dorchester, MA 02122For Sale
 MLS ID #73591947, Adams & Co. Team, Real Broker MA, LLC. MLS PIN
- $990,0007 bd4 ba2.9k sqft66 Burrell St, Roxbury, MA 02119For Sale
 MLS ID #73592758, Derouen Levinson Group, Keller Williams Realty. MLS PIN
