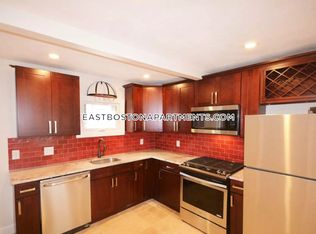
Priced at a 6.8 CAP and just 136-times the gross monthly rent, this totally renovated EAGLE HILL three-family has units with renovated kitchens and baths, central air conditioning, in-unit laundry and sprinklers. Near T. This is the perfect property for the person who isn't interested in buying flawed multifamily properties that require getting involved in costly renovations that always take longer and cost more that originally anticipated.
For sale
Price cut: $50K (11/1)
$1,249,000
130 Brooks St, East Boston, MA 02128
6beds
2,329sqft
3 Family
Built in 1875
-- sqft lot
$-- Zestimate®
$536/sqft
$-- HOA
What's special
Central air conditioningIn-unit laundryRenovated kitchens
- 34 days
- 144
- 10
Zillow last checked:
Listing updated:
Listed by:
David Bates 617-413-6345,
William Raveis R.E. & Home Services 781-828-4550
Source: MLS PIN,MLS#: 73589715
Facts & features
Interior
Bedrooms & bathrooms
- Bedrooms: 6
- Bathrooms: 3
- Full bathrooms: 3
Features
- Has basement: Yes
- Has fireplace: No
Interior area
- Total structure area: 2,329
- Total interior livable area: 2,329 sqft
- Finished area above ground: 2,329
Property
Features
- Waterfront features: 1 to 2 Mile To Beach
Lot
- Size: 1,125 Square Feet
- Features: Gentle Sloping
Details
- Parcel number: 1333369
- Zoning: Res
Construction
Type & style
- Home type: MultiFamily
- Property subtype: 3 Family
Materials
- Foundation: Block
Condition
- Year built: 1875
Utilities & green energy
- Sewer: Public Sewer
- Water: Public
Community & HOA
Location
- Region: East Boston
Financial & listing details
- Price per square foot: $536/sqft
- Tax assessed value: $935,400
- Annual tax amount: $11,599
- Date on market: 10/11/2026
- Total actual rent: 9200
Estimated market value
Not available
Estimated sales range
Not available
$2,625/mo
Price history
| Date | Event | Price |
|---|---|---|
| 11/1/2026 | Price change | $1,249,000-3.8%$536/sqft |
Source: MLS PIN #73589715 Report a problem | ||
| 10/12/2026 | Listed for sale | $1,299,000+271.1%$558/sqft |
Source: MLS PIN #73589715 Report a problem | ||
| 4/3/2025 | Listing removed | $3,000$1/sqft |
Source: Zillow Rentals Report a problem | ||
| 3/15/2025 | Listed for rent | $3,000+3.4%$1/sqft |
Source: Zillow Rentals Report a problem | ||
| 6/7/2024 | Listing removed | -- |
Source: Zillow Rentals Report a problem | ||
| 5/17/2024 | Listed for rent | $2,900-3.3%$1/sqft |
Source: Zillow Rentals Report a problem | ||
| 4/29/2024 | Listing removed | -- |
Source: Zillow Rentals Report a problem | ||
| 3/14/2024 | Listed for rent | $3,000+20%$1/sqft |
Source: Zillow Rentals Report a problem | ||
| 5/1/2020 | Listing removed | $2,500$1/sqft |
Source: Grand Alexandre Team Report a problem | ||
| 3/24/2020 | Listed for rent | $2,500+4.2%$1/sqft |
Source: Grand Alexandre Team Report a problem | ||
| 3/19/2019 | Listing removed | $2,400$1/sqft |
Source: Owner Report a problem | ||
| 2/15/2019 | Listed for rent | $2,400+14.3%$1/sqft |
Source: Owner Report a problem | ||
| 8/24/2017 | Listing removed | $2,100$1/sqft |
Source: Scott Hyman Report a problem | ||
| 5/10/2017 | Listed for rent | $2,100$1/sqft |
Source: Centre Realty Group Report a problem | ||
| 1/20/2017 | Sold | $350,000+27.3%$150/sqft |
Source: Public Record Report a problem | ||
| 5/19/2010 | Sold | $275,000+48.1%$118/sqft |
Source: Public Record Report a problem | ||
| 4/24/2010 | Listed for sale | $185,700-46.1%$80/sqft |
Source: Saul Cohen #71047775 Report a problem | ||
| 5/14/2008 | Sold | $344,250-28.3%$148/sqft |
Source: Public Record Report a problem | ||
| 4/28/2005 | Sold | $480,000+17.1%$206/sqft |
Source: Public Record Report a problem | ||
| 1/9/2004 | Sold | $410,000+223.6%$176/sqft |
Source: Public Record Report a problem | ||
| 4/16/1999 | Sold | $126,700+352.5%$54/sqft |
Source: Public Record Report a problem | ||
| 8/11/1994 | Sold | $28,000-54.1%$12/sqft |
Source: Public Record Report a problem | ||
| 11/16/1989 | Sold | $61,000$26/sqft |
Source: Public Record Report a problem | ||
Public tax history
| Year | Property taxes | Tax assessment |
|---|---|---|
| 2025 | $10,517 +9.4% | $908,200 +3% |
| 2024 | $9,611 +2.5% | $881,700 +1% |
| 2023 | $9,376 +7.6% | $873,000 +9% |
| 2022 | $8,714 +2% | $800,900 |
| 2021 | $8,546 +7.8% | $800,900 +6.7% |
| 2020 | $7,928 +12.2% | $750,800 +12% |
| 2019 | $7,065 +28.1% | $670,300 +27.3% |
| 2018 | $5,517 +404.2% | $526,400 +15% |
| 2017 | $1,094 -75% | $457,600 +15% |
| 2016 | $4,377 +9.6% | $397,900 +20.6% |
| 2015 | $3,994 +12.9% | $329,800 +22.5% |
| 2013 | $3,537 +2.7% | $269,200 +1.9% |
| 2012 | $3,444 +2% | $264,100 |
| 2011 | $3,378 +1.2% | $264,100 -6% |
| 2010 | $3,338 +2.5% | $281,000 -8.2% |
| 2009 | $3,255 -28.2% | $306,200 -25.9% |
| 2008 | $4,531 -3.6% | $413,000 -3.4% |
| 2007 | $4,700 | $427,700 |
Find assessor info on the county website
Monthly payment
Est. payment
Payment breakdown
Explore the cost of this home by adjusting the details. Changes won't be saved.Climate risks
Neighborhood: East Boston



Similar homes
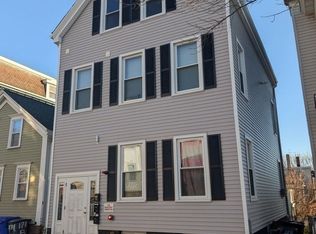
- $1,600,0007 bd3 ba2.9k sqft167 Lexington St, East Boston, MA 02128For Sale
 MLS ID #73488507, Blake La Grassa, Compass. MLS PIN
- $835,0004 bd3 ba1.9k sqft248 Princeton St, East Boston, MA 02128For Sale
 MLS ID #73574910, Maria Babakhanova, Redfin Corp.. MLS PIN
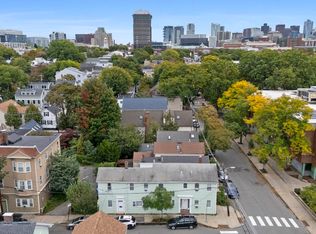
- $1,225,0005 bd3 ba1.9k sqft56-58 8th St, Cambridge, MA 02141For Sale
 MLS ID #73587683, Joshua Drawas, Compass. MLS PIN
- $1,174,9005 bd3 ba2.1k sqft35 Franklin Ave, Somerville, MA 02145For Sale
 MLS ID #73563730, Paul B. Campano, Keller Williams Realty Boston Northwest. MLS PIN
