MAYFAIR AREA, LEGAL 3-LEGAL FLAT, 3 BEDROOMS 1st & 2nd, 1 BEDROOM IN GARDEN UNIT. SEPARATE UTILITIES, COPPER PLUMBING, UPDATED KITCHEN, TUCK POINTED, LARGE ENCLOSED BACK PORCH, LONG-TERM TENANTS ON MTM BASIS. RENTS ARE LOW BUT POTENTIAL TO INCREASE MUCH HIGHER. PARKING OFF STREET. CLOSE TO I-94, I-90, MINUTES DOWNTOWN, LAKE MICHIGAN, SHOPPING MALLS, GROCERIES, ETC.CONVENIENT LOCATION.
Contingent
Price cut: $4K (8/27)
$685,888
4524 W Lawrence Ave, Chicago, IL 60630
7beds
--sqft
Multi Family
Built in 1927
-- sqft lot
$668,900 Zestimate®
$--/sqft
$-- HOA
What's special
Large enclosed back porchUpdated kitchenCopper plumbingParking off street
- 77 days
- 26
- 0
Zillow last checked:
Listing updated:
Listed by:
Arceli Antonio 847-293-5111,
RE/MAX City
Source: MRED as distributed by MLS GRID,MLS#: 12744833
Facts & features
Interior
Bedrooms & bathrooms
- Bedrooms: 7
- Bathrooms: 3
- Full bathrooms: 3
Heating
- Natural Gas, Forced Air
Features
- Basement: Finished,Full,Walk-Out Access
Property
Parking
- Total spaces: 2
- Parking features: Yes, Garage Owned, Detached, Garage
- Garage spaces: 2
Lot
- Size: 3,125 Square Feet
- Dimensions: 25X125
Details
- Parcel number: 13103110430000
- Zoning: MULTI
- Special conditions: None
Construction
Type & style
- Home type: MultiFamily
- Property subtype: Multi Family
Materials
- Brick
- Roof: Asphalt
Condition
- New construction: No
- Year built: 1927
Utilities & green energy
- Sewer: Public Sewer, Storm Sewer
- Water: Lake Michigan
Community & HOA
Community
- Features: Park, Sidewalks, Street Lights
Location
- Region: Chicago
Financial & listing details
- Tax assessed value: $561,150
- Annual tax amount: $11,376
- Date on market: 8/27/2026
- Ownership: Fee Simple
Estimated market value
$668,900
$635,000 - $702,000
$2,084/mo
Price history
| Date | Event | Price |
|---|---|---|
| 9/17/2026 | Contingent | $685,888 |
Source:  MRED as distributed by MLS GRID #12744833 Report a problem | ||
| 8/27/2026 | Price change | $685,888-0.6% |
Source: MRED as distributed by MLS GRID #12744833 Report a problem | ||
| 5/29/2026 | Listed for sale | $689,900 |
Source: MRED as distributed by MLS GRID #12634765 Report a problem | ||
| 5/22/2026 | Listing removed | $689,900 |
Source: REMAX Report a problem | ||
| 5/20/2026 | Listed for sale | $689,900-1.4% |
Source: REMAX Report a problem | ||
| 4/30/2026 | Listing removed | $699,900 |
Source: MRED as distributed by MLS GRID #12547484 Report a problem | ||
| 1/14/2026 | Price change | $699,900-6.7% |
Source: MRED as distributed by MLS GRID #12547484 Report a problem | ||
| 11/27/2025 | Listed for sale | $749,800+25.2% |
Source: MRED as distributed by MLS GRID #12524730 Report a problem | ||
| 11/3/2023 | Listing removed | -- |
Source: MRED as distributed by MLS GRID #11439293 Report a problem | ||
| 5/2/2023 | Listed for sale | $599,000 |
Source: MRED as distributed by MLS GRID #11439293 Report a problem | ||
| 4/22/2023 | Contingent | $599,000 |
Source: MRED as distributed by MLS GRID #11439293 Report a problem | ||
| 6/17/2022 | Listed for sale | $599,000-0.2% |
Source: MRED as distributed by MLS GRID #11439293 Report a problem | ||
| 6/8/2022 | Listing removed | -- |
Source: MRED as distributed by MLS GRID #11347787 Report a problem | ||
| 4/29/2022 | Price change | $599,999-4.7% |
Source: MRED as distributed by MLS GRID #11347787 Report a problem | ||
| 3/15/2022 | Listed for sale | $629,900+5% |
Source: MRED as distributed by MLS GRID #11347787 Report a problem | ||
| 12/13/2021 | Listing removed | -- |
Source: MRED as distributed by MLS GRID #11146769 Report a problem | ||
| 7/7/2021 | Listed for sale | $599,900+3.4% |
Source: MRED as distributed by MLS GRID #11146769 Report a problem | ||
| 11/17/2018 | Listing removed | $579,900 |
Source: RE/MAX Masters #10032653 Report a problem | ||
| 7/27/2018 | Price change | $579,900+0.2% |
Source: RE/MAX Masters #10032653 Report a problem | ||
| 4/5/2018 | Listed for sale | $579,000-2.7% |
Source: RE/MAX Masters #09675664 Report a problem | ||
| 7/30/2017 | Price change | $594,900-5% |
Source: RE/MAX Masters #09675664 Report a problem | ||
| 6/29/2017 | Listed for sale | $625,900+163% |
Source: RE/MAX Masters #09675664 Report a problem | ||
| 9/23/2011 | Sold | $238,000 |
Source: MRED as distributed by MLS GRID #07850231 Report a problem | ||
Public tax history
| Year | Property taxes | Tax assessment |
|---|---|---|
| 2024 | $11,376 +18.5% | $56,115 +32.3% |
| 2023 | $9,596 +2.6% | $42,403 |
| 2022 | $9,349 +2.4% | $42,403 |
| 2021 | $9,129 +11.8% | $42,403 +16.1% |
| 2020 | $8,166 -3.5% | $36,529 -13% |
| 2019 | $8,464 +1.7% | $41,988 |
| 2018 | $8,321 +24.5% | $41,988 +35.7% |
| 2017 | $6,683 +7.5% | $30,944 |
| 2016 | $6,219 -0.4% | $30,944 -8.9% |
| 2015 | $6,246 +40.9% | $33,967 +42.7% |
| 2014 | $4,432 +2% | $23,800 |
| 2013 | $4,344 -18.7% | $23,800 -20.1% |
| 2012 | $5,343 +8.2% | $29,777 -10.1% |
| 2011 | $4,940 -7.9% | $33,136 -12.4% |
| 2010 | $5,364 +7.9% | $37,811 |
| 2009 | $4,971 -13.2% | $37,811 -18.9% |
| 2008 | $5,725 +7.5% | $46,626 |
| 2007 | $5,324 +16.4% | $46,626 |
| 2006 | $4,573 -10.2% | $46,626 +49.6% |
| 2005 | $5,094 +1% | $31,174 |
| 2004 | $5,043 +2.2% | $31,174 |
| 2003 | $4,933 +26.1% | $31,174 +43.2% |
| 2002 | $3,912 +3.7% | $21,775 |
| 2001 | $3,771 -1.1% | $21,775 |
| 2000 | $3,814 -0.7% | $21,775 +9.7% |
| 1999 | $3,840 | $19,854 |
Find assessor info on the county website
Monthly payment
Est. payment
Payment breakdown
Explore the cost of this home by adjusting the details. Changes won't be saved.Climate risks
Neighborhood: Albany Park
Nearby schools
- $--3 bd1 ba1.2k sqft4524 W Lawrence Ave #2, Chicago, IL 60630Off Market
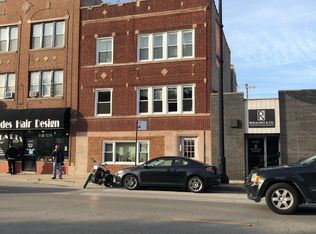
- $--3 bd1 ba1.2k sqft4524 W Lawrence Ave FL 2ND, Chicago, IL 60630Off Market
- $--3 bd1 ba1.2k sqft4524 W Lawrence Avenue #2nd Middle Floor, Chicago, IL 60630Off Market
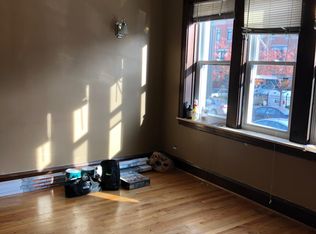
- $--3 bd1 ba1.2k sqft4524 W Lawrence Ave #1, Chicago, IL 60630Off Market
Similar homes
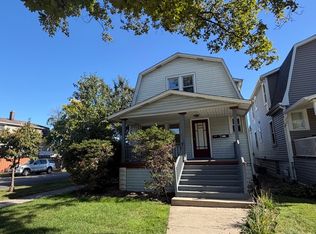
- $599,9995 bd3 ba3.3k sqft5117 N Kolmar Ave, Chicago, IL 60630Active
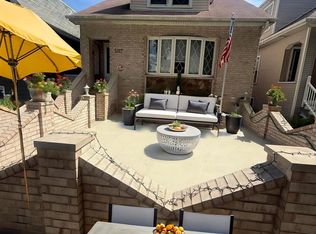 MLS ID #12742990, Tuan X Do, Real People Realty. MRED as distributed by MLS GRID
- $740,0006 bd2 ba-- sqft5236 W Montrose Ave, Chicago, IL 60641Active
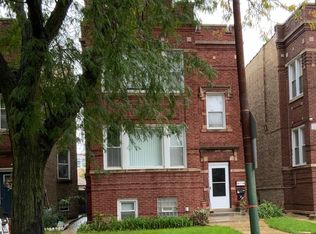 MLS ID #12776241, Margarito A Martinez, PMA Real Estate, Inc.. MRED as distributed by MLS GRID
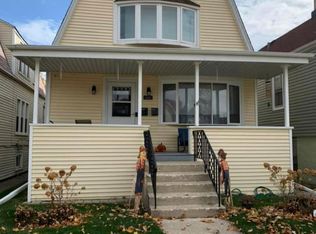
- $549,9004 bd2 ba-- sqft5377 N Magnet Ave, Chicago, IL 60630Active
 MLS ID #12785670, Danny McGovern, RE/MAX Properties Northwest. MRED as distributed by MLS GRID
- $655,0004 bd2 ba-- sqft5631 N Parkside Ave, Chicago, IL 60646Active
 MLS ID #12751659, Daniel Nierman, 4 Sale Realty Advantage LLC. MRED as distributed by MLS GRID
