$105,000
4 bd|3 ba|-- sqft
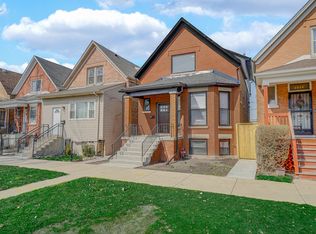
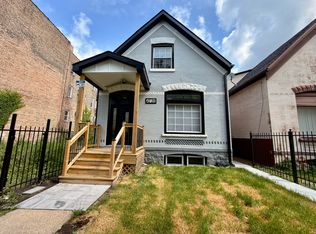
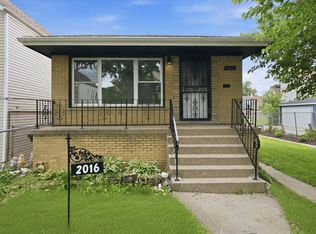
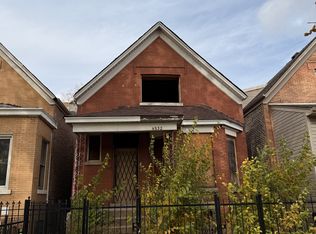
4532 W Maypole Ave, Chicago, IL 60624
Sold
Zillow last checked:
Listing updated:
Nicole Harper (312)882-1705,
RE/MAX Premier
$339,200
$322,000 - $356,000
$2,260/mo
| Date | Event | Price |
|---|---|---|
| 6/18/2026 | Listed for sale | $340,000$218/sqft |
Source: | ||
| 5/20/2026 | Contingent | $340,000$218/sqft |
Source: | ||
| 5/8/2026 | Price change | $340,000-2.9%$218/sqft |
Source: | ||
| 3/31/2026 | Listed for sale | $349,999+809.1%$224/sqft |
Source: | ||
| 4/1/2016 | Sold | $38,500-18.9%$25/sqft |
Source: | ||
| 2/23/2016 | Pending sale | $47,500$30/sqft |
Source: Coldwell Banker Residential Brokerage - Edgebrook #09131096 Report a problem | ||
| 2/4/2016 | Price change | $47,500-20.2%$30/sqft |
Source: Coldwell Banker Residential Brokerage - Edgebrook #09131096 Report a problem | ||
| 11/6/2015 | Price change | $59,500+49.1%$38/sqft |
Source: Coldwell Banker Residential Brokerage - Edgebrook #09078941 Report a problem | ||
| 11/4/2015 | Price change | $39,900-33.5%$26/sqft |
Source: Coldwell Banker Residential Brokerage - Edgebrook #09078941 Report a problem | ||
| 11/2/2015 | Listed for sale | $60,000$38/sqft |
Source: Better Home Relocations LLC #09077516 Report a problem | ||
| Year | Property taxes | Tax assessment |
|---|---|---|
| 2024 | -- | $10,200 +104% |
| 2023 | $1,058 +2.6% | $4,999 |
| 2022 | $1,032 +2.3% | $4,999 |
| 2021 | $1,009 -53.1% | $4,999 -48% |
| 2020 | $2,148 -0.2% | $9,612 -10% |
| 2019 | $2,153 +1.7% | $10,680 |
| 2018 | $2,116 +0.7% | $10,680 +9.8% |
| 2017 | $2,102 +7.8% | $9,730 |
| 2016 | $1,949 | $9,730 |
| 2015 | -- | $9,730 +0.3% |
| 2014 | -- | $9,697 |
| 2013 | $1,764 | $9,697 |
| 2012 | -- | $9,697 -21.7% |
| 2011 | $49 +10.6% | $12,383 |
| 2010 | $44 -94.7% | $12,383 |
| 2009 | $820 +793.4% | $12,383 -8.2% |
| 2008 | $92 -79.2% | $13,485 |
| 2007 | $442 +402.2% | $13,485 |
| 2006 | $88 -49.1% | $13,485 +68.8% |
| 2005 | $173 -4.8% | $7,988 |
| 2004 | $181 -27.5% | $7,988 |
| 2003 | $250 +7.8% | $7,988 +81.1% |
| 2002 | $232 -43.9% | $4,411 |
| 2001 | $413 +63% | $4,411 |
| 2000 | $254 | $4,411 +70.6% |
| 1999 | $254 | $2,586 |
Find assessor info on the county website
Source: MRED as distributed by MLS GRID. This data may not be complete. We recommend contacting the local school district to confirm school assignments for this home.
A local agent can set up tours, give advice and negotiate with sellers.