Exceptional Southern-Exposure Waterfront Opportunity
Discover 454 Flamingo Ave, ideally positioned on a southern-exposure waterfront lot in Naples.
A significant advantage: this home did not flood and is located in Flood Zone X500. This end of the Conners area is known for some of the neighborhood’s higher elevations.
The existing home is in good condition and can be enjoyed immediately, renovated over time, or transformed using the proposed architectural concept.
A rare opportunity combining waterfront living, southern exposure, no prior flooding, and exceptional potential.
For sale by owner
Price increase: $100K (10/10)
$2,700,000
454 Flamingo Ave, Naples, FL 34108
2beds
2,400sqft
SingleFamily
Built in 1989
9,583 Square Feet Lot
$-- Zestimate®
$1,125/sqft
$-- HOA
What's special
Waterfront livingSouthern-exposure waterfront lotSouthern exposure
What the owner loves about this home
southern exposure home is low so it feels like your on the water but above flooding! New HVAC 10/1/26 roof approx 7 years old
- 29 days
- 353
- 10
Listed by:
Property Owner (609) 742-2570
Facts & features
Interior
Bedrooms & bathrooms
- Bedrooms: 2
- Bathrooms: 2
- Full bathrooms: 2
Appliances
- Included: Dishwasher, Dryer, Freezer, Garbage disposal, Microwave, Range / Oven, Refrigerator, Washer
Features
- Flooring: Tile
Interior area
- Total interior livable area: 2,400 sqft
Property
Features
- Exterior features: Cement / Concrete
- Has view: Yes
- View description: Water
- Has water view: Yes
- Water view: Water
Lot
- Size: 9,583 Square Feet
Details
- Parcel number: 27636080008
Construction
Type & style
- Home type: SingleFamily
Materials
- Roof: Metal
Condition
- New construction: No
- Year built: 1989
Community & HOA
Location
- Region: Naples
Financial & listing details
- Price per square foot: $1,125/sqft
- Tax assessed value: $1,720,806
- Annual tax amount: $17,943
- Date on market: 9/19/2026
Estimated market value
Not available
Estimated sales range
Not available
Not available
Price history
| Date | Event | Price |
|---|---|---|
| 10/10/2026 | Price change | $2,700,000+3.8%$1,125/sqft |
Source: Owner Report a problem | ||
| 9/19/2026 | Listed for sale | $2,600,000-5.5%$1,083/sqft |
Source: Owner Report a problem | ||
| 9/3/2026 | Listing removed | $2,750,000$1,146/sqft |
Source:  SWFLMLS #226015955 Report a problem | ||
| 4/17/2026 | Listed for sale | $2,750,000-8.2%$1,146/sqft |
Source: SWFLMLS #226015955 Report a problem | ||
| 6/22/2025 | Listing removed | $2,995,000$1,248/sqft |
Source: SWFLMLS #225007519 Report a problem | ||
| 1/21/2025 | Listed for sale | $2,995,000+8.9%$1,248/sqft |
Source: SWFLMLS #225007519 Report a problem | ||
| 7/24/2024 | Listing removed | -- |
Source: SWFLMLS #224010029 Report a problem | ||
| 2/1/2024 | Listed for sale | $2,750,000$1,146/sqft |
Source:  Coconut Coast Realtors #224010029 Report a problem | ||
| 10/14/2023 | Listing removed | -- |
Source: SWFLMLS #223053750 Report a problem | ||
| 8/2/2023 | Listed for sale | $2,750,000+57.1%$1,146/sqft |
Source: SWFLMLS #223053750 Report a problem | ||
| 6/16/2023 | Sold | $1,750,000-12.5%$729/sqft |
Source:  Florida Gulf Coast MLS #223019489 Report a problem | ||
| 6/8/2023 | Pending sale | $1,999,999$833/sqft |
Source:  Florida Gulf Coast MLS #223019489 Report a problem | ||
| 5/22/2023 | Price change | $1,999,999-10.1%$833/sqft |
Source: Florida Gulf Coast MLS #223019489 Report a problem | ||
| 3/12/2023 | Listed for sale | $2,225,000$927/sqft |
Source: Florida Gulf Coast MLS #223019489 Report a problem | ||
Public tax history
| Year | Property taxes | Tax assessment |
|---|---|---|
| 2025 | $17,943 -6% | $1,720,806 -5.6% |
| 2024 | $19,097 +433.2% | $1,822,381 +383% |
| 2023 | $3,582 -2.5% | $377,284 +3% |
| 2022 | $3,675 -0.8% | $366,295 +3% |
| 2021 | $3,705 +2.4% | $355,626 +1.4% |
| 2020 | $3,618 +1.9% | $350,716 +2.3% |
| 2019 | $3,552 +4.9% | $342,831 +1.9% |
| 2018 | $3,385 -5.9% | $336,439 +2.1% |
| 2017 | $3,598 +1.6% | $329,519 +2.1% |
| 2016 | $3,541 +2.7% | $322,741 +0.7% |
| 2015 | $3,447 -0.7% | $320,498 +19.6% |
| 2014 | $3,471 +5.6% | $267,954 +1.8% |
| 2013 | $3,286 +0.8% | $263,255 +2% |
| 2012 | $3,260 +4% | $258,019 +3.6% |
| 2011 | $3,134 +6.8% | $249,048 +1.8% |
| 2010 | $2,934 +6.4% | $244,629 +3.3% |
| 2009 | $2,758 | $236,883 -17.3% |
| 2008 | $2,758 -10.1% | $286,596 +3% |
| 2007 | $3,067 -2.7% | $278,249 +2.5% |
| 2006 | $3,151 | $271,462 +3% |
| 2005 | $3,151 +2.5% | $263,555 +3% |
| 2004 | $3,075 -0.2% | $255,879 +1.9% |
| 2003 | $3,082 +1.4% | $251,108 +2.4% |
| 2002 | $3,039 -48.2% | $245,223 +1.6% |
| 2001 | $5,871 +102% | $241,361 |
| 2000 | $2,907 | -- |
Find assessor info on the county website
Monthly payment
Est. payment
Payment breakdown
Explore the cost of this home by adjusting the details. Changes won't be saved.Climate risks
Neighborhood: 34108
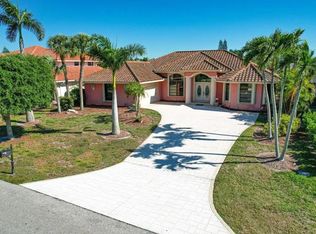
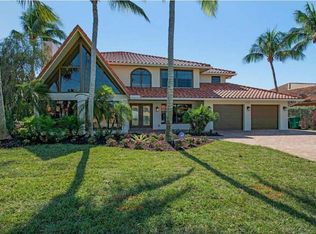
Similar homes
- $2,550,0003 bd2 ba1.8k sqft266 Egret AVE, NAPLES, FL 34108For Sale
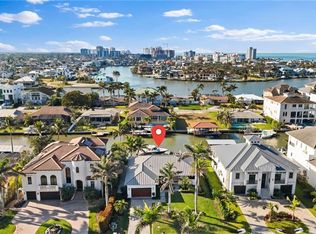
 MLS ID #226007076, Sean Barakett, Your Naples Realty LLC. SWFLMLS
- $2,485,0003 bd2 ba1.7k sqft373 Egret AVE, NAPLES, FL 34108For Sale
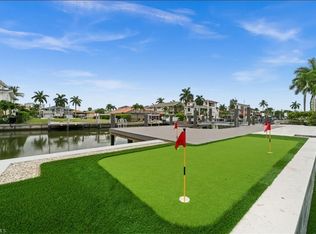 MLS ID #226023041, Angie Curkovic, Equity Realty. SWFLMLS
- $2,699,0003 bd3 ba2.3k sqft353 CARLTON PL #33, NAPLES, FL 34108For Sale
 MLS ID #226035315, Kathy Smith, John R Wood Properties. SWFLMLS
- $3,475,0005 bd5 ba3.4k sqft494 Seagull AVE, NAPLES, FL 34108For Sale
 MLS ID #226037228, Ryan Schwartz, Naples Homes. SWFLMLS
- $2,850,0003 bd2 ba2k sqft643 Bridgeway LN, NAPLES, FL 34108For SaleMLS ID #226035970, Marc Fitzgerald, Premier Sotheby's Int'l Realty. SWFLMLS
- $2,500,0004 bd5 ba3.1k sqft605 91st AVE N, NAPLES, FL 34108For SaleMLS ID #226032790, Emily Konopasek, Your Naples Realty LLC. SWFLMLS
- $3,750,0003 bd3 ba2.1k sqft151 BAYVIEW AVE, NAPLES, FL 34108For SaleMLS ID #226021645, Laura Brucer, Keller Williams Elite Realty. SWFLMLS
- $1,519,0003 bd2 ba1.9k sqft551 99th AVE N, NAPLES, FL 34108For SaleMLS ID #226034590, Mari Vesci, John R Wood Properties. SWFLMLS
- $2,750,0004 bd3 ba2.4k sqft3777 Fountainhead LN, NAPLES, FL 34103For SaleMLS ID #226015187, Samantha Ford, John R Wood Properties. SWFLMLS
- $2,895,0003 bd3 ba2k sqft2105 SHEEPSHEAD DR, NAPLES, FL 34102For SaleMLS ID #226036243, Joseph Caveney, William Raveis Real Estate. SWFLMLS
- $2,799,0003 bd2 ba2.8k sqft1131 7th AVE N, NAPLES, FL 34102For SaleMLS ID #226035414, Cheryl Rauch, Downing Frye Realty Inc.. SWFLMLS
- $1,395,0002 bd2 ba1.4k sqft6622 Trident WAY #G4, NAPLES, FL 34108For SaleMLS ID #226030093, Bonnie Nageon De Lestang, Premier Sotheby's Int'l Realty. SWFLMLS
- $2,849,0003 bd3 ba2.4k sqft3280 66th ST SW, NAPLES, FL 34105For SaleMLS ID #226028831, Vivian Ferreira, Premiere Plus Realty Company. SWFLMLS
- $2,695,0003 bd2 ba1.9k sqft1250 Tuna CT, NAPLES, FL 34102For SaleMLS ID #226020249, Jesse McGreevy, DomainRealty.com LLC. SWFLMLS
- $1,795,0004 bd4 ba1.9k sqft828 100th AVE N, NAPLES, FL 34108For SaleMLS ID #226029116, Matt Bianchini, Bonnycastle Realty. SWFLMLS
- $1,899,0004 bd3 ba2.1k sqft668 93rd AVE N, NAPLES, FL 34108New ConstructionMLS ID #226034864, Joseph Ghannam, LLC, Premiere Plus Realty Company. SWFLMLS
- $1,399,0004 bd2 ba1.5k sqft841 91st AVE N, NAPLES, FL 34108For SaleMLS ID #226014313, Nicole Dirsino, Premiere Plus Realty Company. SWFLMLS
- $1,800,0004 bd4 ba3k sqft678 95th AVE N, NAPLES, FL 34108For SaleMLS ID #225058680, Steve Bacardi, LLC, Coldwell Banker Realty. SWFLMLS
- $3,095,0003 bd3 ba2.5k sqft1420 Jewel Box AVE, NAPLES, FL 34102For SaleMLS ID #226034349, Karolina Kasbi, Premiere Plus Realty Company. SWFLMLS
- $2,150,0005 bd3 ba2.9k sqft9833 Clear Lake CIR, NAPLES, FL 34109For SaleMLS ID #226026709, Tricia Kowaleski, Coldwell Banker Realty. SWFLMLS
