LSSD
Pending
$70,000
464 Sparks Ln, Walled Lake, MI 48390
3beds
1,815sqft
Single Family Residence
Built in 2002
10,018 Square Feet Lot
$-- Zestimate®
$39/sqft
$-- HOA
What's special
- 1 day
- 6
- 0
Zillow last checked:
Listing updated:
Listed by:
Jason F Childs 248-755-2030,
KW Showcase Realty 248-360-2900
Source: Realcomp II,MLS#: 20261081692
Facts & features
Interior
Bedrooms & bathrooms
- Bedrooms: 3
- Bathrooms: 2
- Full bathrooms: 2
Bedroom
- Level: Entry
- Area: 100
- Dimensions: 10 X 10
Bedroom
- Level: Entry
- Area: 120
- Dimensions: 10 X 12
Bedroom
- Level: Entry
- Area: 120
- Dimensions: 10 X 12
Other
- Level: Entry
- Area: 30
- Dimensions: 5 X 6
Other
- Level: Entry
- Area: 30
- Dimensions: 6 X 5
Kitchen
- Level: Entry
- Area: 120
- Dimensions: 10 X 12
Heating
- Forced Air, Natural Gas
Features
- Has basement: No
- Has fireplace: No
Interior area
- Total interior livable area: 1,815 sqft
- Finished area above ground: 1,815
Property
Parking
- Parking features: No Garage
Features
- Levels: One
- Stories: 1
- Entry location: GroundLevel
- Pool features: None
Lot
- Size: 10,018 Square Feet
- Dimensions: 100 x 100
Details
- Parcel number: 1735301021
- Special conditions: Short Sale,Standard
Construction
Type & style
- Home type: SingleFamily
- Architectural style: Modular Home
- Property subtype: Single Family Residence
Materials
- Vinyl Siding
- Foundation: Crawl Space
Condition
- New construction: No
- Year built: 2002
Utilities & green energy
- Sewer: Public Sewer
- Water: Public
Community & HOA
Community
- Subdivision: CLUTZ LAKEVIEW WOODLANDS
HOA
- Has HOA: No
Location
- Region: Walled Lake
Financial & listing details
- Price per square foot: $39/sqft
- Tax assessed value: $150,830
- Annual tax amount: $6,287
- Date on market: 10/8/2026
- Listing agreement: Exclusive Right To Sell
- Listing terms: Cash
Estimated market value
Not available
Estimated sales range
Not available
$2,462/mo
Price history
| Date | Event | Price |
|---|---|---|
| 10/27/2023 | Sold | $242,000-3.2%$133/sqft |
Source:  MiRealSource #50122165 Report a problem | ||
| 10/21/2023 | Pending sale | $249,900$138/sqft |
Source: MiRealSource #50122165 Report a problem | ||
| 9/15/2023 | Listed for sale | $249,900+89.2%$138/sqft |
Source: MiRealSource #50122165 Report a problem | ||
| 3/29/2023 | Sold | $132,116-26.6%$73/sqft |
Source: Public Record Report a problem | ||
| 8/1/2022 | Pending sale | $180,000$99/sqft |
Source:  Realcomp II #2220034329 Report a problem | ||
| 7/28/2022 | Listed for sale | $180,000$99/sqft |
Source: Realcomp II #2220034329 Report a problem | ||
| 7/19/2022 | Pending sale | $180,000$99/sqft |
Source: Realcomp II #2220034329 Report a problem | ||
| 7/6/2022 | Price change | $180,000-10%$99/sqft |
Source: Realcomp II #2220034329 Report a problem | ||
| 6/4/2022 | Listed for sale | $200,000+56.3%$110/sqft |
Source: Realcomp II #2220034329 Report a problem | ||
| 10/31/2018 | Sold | $128,000+4.6%$71/sqft |
Source: Public Record Report a problem | ||
| 11/12/2015 | Sold | $122,325$67/sqft |
Source: Public Record Report a problem | ||
Public tax history
| Year | Property taxes | Tax assessment |
|---|---|---|
| 2025 | $6,112 -8.5% | $178,620 +22.1% |
| 2024 | $6,681 +54.4% | $146,300 +4.7% |
| 2023 | $4,326 -1.3% | $139,730 +12.2% |
| 2022 | $4,383 +0.2% | $124,590 +1.2% |
| 2021 | $4,375 | $123,070 +3.5% |
| 2020 | -- | $118,930 +20.7% |
| 2019 | $4,278 +26.1% | $98,560 +23.2% |
| 2018 | $3,392 +34.9% | $80,010 -0.1% |
| 2017 | $2,515 | $80,120 +18.3% |
| 2016 | $2,515 | $67,710 +11.1% |
| 2015 | -- | $60,960 +13.3% |
| 2014 | -- | $53,820 -6.9% |
| 2011 | -- | $57,810 +0.8% |
| 2010 | $2,389 -19.1% | $57,330 -20.6% |
| 2009 | $2,953 -6.9% | $72,210 -57.4% |
| 2005 | $3,172 | $169,520 +43.2% |
| 2003 | -- | $118,410 +139.3% |
| 2002 | -- | $49,480 +76.5% |
| 2001 | $1,167 +6.3% | $28,040 +3.2% |
| 2000 | $1,098 | $27,180 |
Find assessor info on the county website
Monthly payment
Est. payment
Payment breakdown
Explore the cost of this home by adjusting the details. Changes won't be saved.Climate risks
Neighborhood: 48390
Similar homes
- $77,5003 bd2 ba1.9k sqft8205 Harrow Ct, Northville, MI 48167For Sale
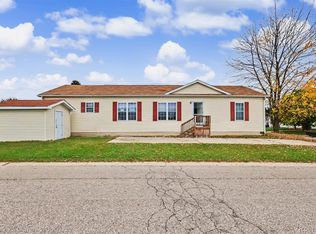
 MLS ID #20261088606, Timothy Hillmer, Century 21 Curran & Oberski. Realcomp II
- $78,0004 bd2 ba1.6k sqft30153 Joliet Ct, Novi, MI 48377For Sale
 MLS ID #20261072610, Leah Schaedig, Berkshire Hathaway HomeServices Kee Realty Browns. Realcomp II
- $95,0003 bd2 ba1.6k sqft18426 Winthrop St, Detroit, MI 48235For Sale
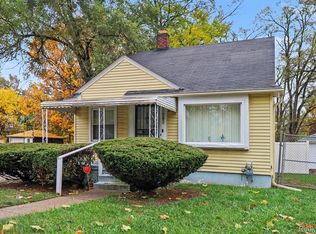 MLS ID #20261090168, Adrienne Stewart, Keller Williams HomeTowne. Realcomp II
- $70,0003 bd2 ba1.6k sqftSpringrove MHC, Davisburg, MI 48350For Sale
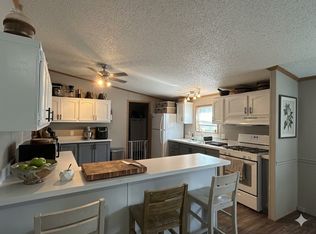 MLS ID #604478, Angie Guzman. MHBO
- $60,0003 bd1 ba1k sqft14960 Littlefield St, Detroit, MI 48227For SaleMLS ID #20261088620, Ligia M Godoy, CMB Real Estate. Realcomp II
- $70,0003 bd1 ba1.1k sqft17408 Fenton St, Detroit, MI 48219For SaleMLS ID #20261085987, Ligia M Godoy, CMB Real Estate. Realcomp II
- $57,5002 bd2 ba1.4k sqft211 Pinewood Dr, White Lake, MI 48386For SaleMLS ID #20261088680, Marsha D Glasgow, Keller Williams First. Realcomp II
- $50,0003 bd1 ba1.1k sqft19969 Biltmore St, Detroit, MI 48235For SaleMLS ID #20261089686, Monique Davis, Front Page Properties. Realcomp II
- $69,9003 bd1 ba980 sqft18344 Shiawassee Dr, Detroit, MI 48219For SaleMLS ID #20261076462, Michael Coury, 3Sixty5 Realty. Realcomp II
- $105,0003 bd1 ba1.8k sqft16146 Prevost St, Detroit, MI 48235For SaleMLS ID #20261089695, Monique Davis, Front Page Properties. Realcomp II
- $69,0003 bd1 ba1.1k sqft8620 Fielding St, Detroit, MI 48228For SaleMLS ID #20261050794, Natalie Vaughn, National Realty Centers, Inc. Realcomp II
- $70,0003 bd2 ba1.6k sqft11320 Grandville Ave, Detroit, MI 48228For SaleMLS ID #20250016553, Kenneth F Evans, Reach Realty Group. Realcomp II
- $69,5003 bd2 ba1.4k sqft13960 Montrose St, Detroit, MI 48227For SaleMLS ID #20261062018, Sam Hantosh, RE/MAX Team 2000. Realcomp II
- $69,0003 bd1 ba1k sqft17634 Westbrook St, Detroit, MI 48219For SaleMLS ID #20261066282, Maricela Meza, Realty of America. Realcomp II
- $89,9003 bd1 ba1.2k sqft19335 Lenore, Detroit, MI 48219For SaleMLS ID #20261084884, Moe Bzeih, Metro Brook Realtors. Realcomp II
- $70,0003 bd1 ba960 sqft8211 Artesian St, Detroit, MI 48228For Sale
 MLS ID #50224274, Matthew Crossley, Berkshire Hathaway HomeServices Kee Realty. MiRealSource
- $74,9003 bd2 ba1k sqft15519 Westbrook St, Detroit, MI 48223For SaleMLS ID #20261010210, Greg Majewski, Detroit Investment Company. Realcomp II
