LOOKING FOR AN INVESTMENT PROPERTY OR A PROPERTY THAT YOU CAN LIVE ON ONE SIDE AND RENT THE OTHER TO TAKE A LOAD OFF WITH YOUR MORTGAGE. ALL BRICK DOUBLE IN NEW ORLEANS EAST. 1 UNIT HAS 3 BEDS/1 BATH AND THE OTHER HAS 2 BEDS/1 BATH. BOTH UNITS ARE UNDERRENTED. EACH UNIT HAS OFF STREET PARKING AND SEPERATE BACK YARDS. SELLER MOTIVATED. SCHEDULE YOUR APPOINTMENT.
For sale
$214,999
4715 Lynhuber Dr, New Orleans, LA 70126
5beds
--sqft
Duplex
Built in 1971
-- sqft lot
$-- Zestimate®
$--/sqft
$-- HOA
What's special
All brick double
- 12 days
- 6
- 0
Zillow last checked:
Listing updated:
Listed by:
Nicole D Pellerin,
The Pellerin Group NOLA LLC 504-447-2479
Source: ROAM MLS,MLS#: 2548236
Facts & features
Interior
Bedrooms & bathrooms
- Bedrooms: 5
- Bathrooms: 2
- Full bathrooms: 2
Heating
- Central
Cooling
- Central Air
Interior area
- Total structure area: 2,127
Video & virtual tour
Property
Parking
- Parking features: Driveway
- Has uncovered spaces: Yes
Lot
- Size: 4,930 Square Feet
- Dimensions: 58 x 85
- Features: Other
Details
- Parcel number: 39W939902
Construction
Type & style
- Home type: MultiFamily
- Architectural style: Ranch
- Property subtype: Duplex
Materials
- Brick
- Foundation: Slab
Condition
- Year built: 1971
Utilities & green energy
- Sewer: Public Sewer
- Water: Public
- Utilities for property: Natural Gas Available
Community & HOA
Location
- Region: New Orleans
Financial & listing details
- Tax assessed value: $166,900
- Annual tax amount: $2,203
- Date on market: 3/18/2026
Estimated market value
Not available
Estimated sales range
Not available
$2,189/mo
Price history
| Date | Event | Price |
|---|---|---|
| 10/23/2026 | Listed for sale | $214,9990% |
Source:  ROAM MLS #2548236 Report a problem | ||
| 1/29/2023 | Listing removed | -- |
Source:  GSREIN #2356133 Report a problem | ||
| 10/13/2022 | Price change | $215,000-4.4% |
Source: GSREIN #2356133 Report a problem | ||
| 7/30/2022 | Listed for sale | $225,000 |
Source: GSREIN #2356133 Report a problem | ||
| 11/26/2019 | Sold | -- |
Source: Public Record Report a problem | ||
| 12/18/1998 | Sold | -- |
Source: ROAM MLS #370083 Report a problem | ||
Public tax history
| Year | Property taxes | Tax assessment |
|---|---|---|
| 2026 | $2,203 | $16,690 |
| 2025 | $2,203 -1.5% | $16,690 |
| 2024 | $2,236 +106.9% | $16,690 +17.1% |
| 2023 | $1,081 -43.4% | $14,250 +5% |
| 2022 | $1,909 -6.9% | $13,570 -4.8% |
| 2021 | $2,051 | $14,250 +26.4% |
| 2020 | -- | $11,270 |
| 2019 | $1,703 | $11,270 |
| 2018 | $1,703 | $11,270 |
| 2017 | $1,703 -1.9% | $11,270 |
| 2016 | $1,736 +1.5% | $11,270 -2% |
| 2015 | $1,711 | $11,500 |
| 2014 | $1,711 +0% | $11,500 |
| 2013 | $1,710 | $11,500 +30.8% |
| 2012 | -- | $8,790 +3.4% |
| 2011 | -- | $8,500 |
| 2010 | -- | $8,500 +424.7% |
| 2009 | -- | $1,620 |
| 2007 | -- | $1,620 |
Find assessor info on the county website
Monthly payment
Est. payment
Payment breakdown
Explore the cost of this home by adjusting the details. Changes won't be saved.Climate risks
Neighborhood: Pines Village


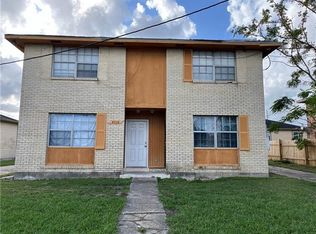
Similar homes
- $--4 bd3 ba3.7k sqft7442 Springlake Dr, New Orleans, LA 70126Auction
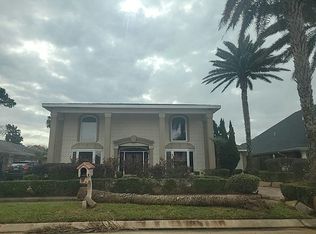 Auction.com 2
- $199,0006 bd2 ba-- sqft4401 Eastview Dr, New Orleans, LA 70126For Sale
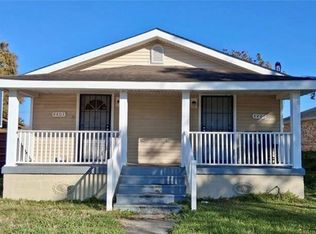
 MLS ID #2582471, Brandon M Salassi, 1 Percent Lists. ROAM MLS
- $169,0004 bd2 ba-- sqft4709 Shalimar Dr, New Orleans, LA 70126For Sale
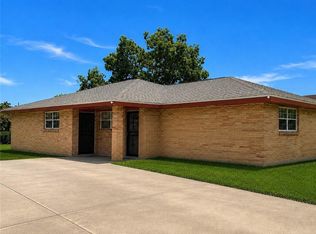 MLS ID #2567200, Amanda M Broussard, Broussard Realty Pros. ROAM MLS
- $189,0004 bd2 ba-- sqft4963 Camelia St, New Orleans, LA 70126For Sale
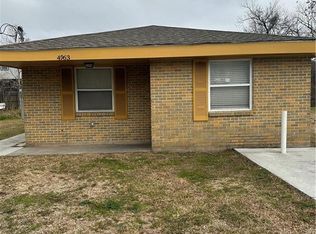 MLS ID #2550085, Kevin Ard, WEICHERT, REALTORS - LaBranch. ROAM MLS
- $229,9004 bd3 ba2.7k sqft4327 Ray Ave, New Orleans, LA 70126For SaleMLS ID #2578933, Judy B Walker, KELLER WILLIAMS REALTY 4550100. ROAM MLS
- $259,9006 bd4 ba-- sqft4550 Francis Dr, New Orleans, LA 70126For SaleMLS ID #2578235, Kristen L Young-Boyd, Boyd Realtors, LLC. ROAM MLS
- $235,0004 bd3 ba1.6k sqft4742 Virgilian St, New Orleans, LA 70126For SaleMLS ID #2508438, Diana C Parsons, United Real Estate Partners. ROAM MLS
- $220,0004 bd3 ba2.8k sqft7501 Morrison Rd, New Orleans, LA 70126For SaleMLS ID #2549651, Rodney D Greenup, Greenup & Associates, LLC. ROAM MLS
- $239,0004 bd2 ba2.3k sqft7817 Duke Ct, New Orleans, LA 70126For SaleMLS ID #200MCB, DaVante Jenkins-Gethers, Whit Ownership LLC. ROAM MLS
- $205,0005 bd2 ba-- sqft6230-6232 Eads St, New Orleans, LA 70122For SaleMLS ID #2576068, Ashton Brumfield, La Maison Luxe Realty Group LLC. ROAM MLS
- $199,9003 bd2 ba1.7k sqft6060 Curran Blvd, New Orleans, LA 70126For SaleMLS ID #200IGZ, Sarah L Katko, Crescent City Living, LLC. ROAM MLS
- $205,9505 bd3 ba-- sqft8811 Bunker Hill Rd, New Orleans, LA 70127For SaleMLS ID #2581721, Carlette J Smith, Real Property Realtors. ROAM MLS
- $210,0003 bd2 ba1.7k sqft6606 Bamberry St, New Orleans, LA 70126For SaleMLS ID #2580574, Joshua S Hughes, United Brokers of Louisiana. ROAM MLS
- $225,0005 bd3 ba-- sqft7110 Bunker Hill Rd, New Orleans, LA 70127For SaleMLS ID #2580377, Lakeisha N Walker, The Pellerin Group NOLA LLC. ROAM MLS
- $156,0004 bd2 ba-- sqft4334 Majestic Oaks Dr, New Orleans, LA 70126For SaleMLS ID #2570501, Duane T Evans, LEONE GNO REALTY LLC. ROAM MLS
- $230,0004 bd2 ba2.1k sqft7533 Mayo Rd, New Orleans, LA 70126For SaleMLS ID #2572421, Hilda Venson, Compass Historic. ROAM MLS
- $230,0005 bd3 ba-- sqft7050 Bunker Hill Rd, New Orleans, LA 70127For SaleMLS ID #2566878, Ayanna Chanel Fultz, Belle South Realty Group LLC. ROAM MLS
- $225,0006 bd6 ba-- sqft6921-23 Yorktown Dr, New Orleans, LA 70127For SaleMLS ID #2576005, Kendra St. Pierre, Compass Slidell. ROAM MLS
- $205,9006 bd6 ba-- sqft8901 Bunker Hill Rd, New Orleans, LA 70127For SaleMLS ID #2577087, Byron K Fazande, Quality One Realty. ROAM MLS
