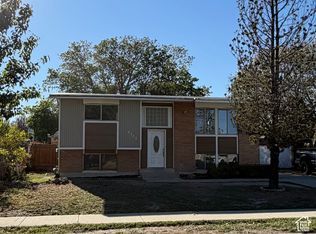
This 2452 square foot single family home has 4 bedrooms and 3.0 bathrooms. This home is located at 4822 W 7000 S, West Jordan, UT 84081.
Pre-foreclosure
Street View
Est. $487,800
4822 W 7000 S, West Jordan, UT 84081
4beds
3baths
2,452sqft
SingleFamily
Built in 1992
6,098 Square Feet Lot
$487,800 Zestimate®
$199/sqft
$-- HOA
Overview
- 180 days
- 24
- 2
Facts & features
Interior
Bedrooms & bathrooms
- Bedrooms: 4
- Bathrooms: 3
Heating
- Other, Gas
Cooling
- Central
Appliances
- Included: Dishwasher, Garbage disposal, Microwave, Range / Oven, Refrigerator
Features
- Flooring: Tile, Carpet, Laminate
- Basement: Finished
- Has fireplace: No
Interior area
- Total interior livable area: 2,452 sqft
Property
Parking
- Parking features: Garage - Attached
Features
- Exterior features: Vinyl, Brick
- Has view: Yes
- View description: City, Mountain
Lot
- Size: 6,098 Square Feet
Details
- Parcel number: 20244770350000
Construction
Type & style
- Home type: SingleFamily
Materials
- Other
- Roof: Asphalt
Condition
- Year built: 1992
Community & HOA
Location
- Region: West Jordan
Financial & listing details
- Price per square foot: $199/sqft
- Tax assessed value: $491,600
- Annual tax amount: $2,771
Foreclosure details
Estimated market value
$487,800
$463,000 - $512,000
$2,789/mo
Price history
| Date | Event | Price |
|---|---|---|
| 4/29/2026 | Listed for sale | $490,000$200/sqft |
Source:  UtahRealEstate.com #2128032 Report a problem | ||
| 4/21/2026 | Pending sale | $490,000$200/sqft |
Source: UtahRealEstate.com #2128032 Report a problem | ||
| 4/17/2026 | Price change | $490,000-10.9%$200/sqft |
Source: UtahRealEstate.com #2128032 Report a problem | ||
| 4/3/2026 | Price change | $550,000+18.3%$224/sqft |
Source: UtahRealEstate.com #2128032 Report a problem | ||
| 3/26/2026 | Price change | $465,000-1.1%$190/sqft |
Source: UtahRealEstate.com #2128032 Report a problem | ||
| 3/23/2026 | Price change | $470,000-4.1%$192/sqft |
Source: UtahRealEstate.com #2128032 Report a problem | ||
| 3/12/2026 | Price change | $489,900-1%$200/sqft |
Source: UtahRealEstate.com #2128032 Report a problem | ||
| 3/6/2026 | Price change | $495,000-5.7%$202/sqft |
Source: UtahRealEstate.com #2128032 Report a problem | ||
| 2/23/2026 | Price change | $525,000-0.9%$214/sqft |
Source: UtahRealEstate.com #2128032 Report a problem | ||
| 2/12/2026 | Price change | $530,000-3.6%$216/sqft |
Source: UtahRealEstate.com #2128032 Report a problem | ||
| 2/8/2026 | Price change | $550,000-1.8%$224/sqft |
Source: UtahRealEstate.com #2128032 Report a problem | ||
| 1/21/2026 | Price change | $560,000-1.8%$228/sqft |
Source: UtahRealEstate.com #2128032 Report a problem | ||
| 12/25/2025 | Price change | $570,000+5.6%$232/sqft |
Source: UtahRealEstate.com #2128032 Report a problem | ||
| 10/4/2023 | Price change | $540,000-0.9%$220/sqft |
Source: UtahRealEstate.com #1896904 Report a problem | ||
| 9/28/2023 | Price change | $545,000-0.9%$222/sqft |
Source: UtahRealEstate.com #1896904 Report a problem | ||
| 9/13/2023 | Price change | $550,000-1.8%$224/sqft |
Source: UtahRealEstate.com #1896904 Report a problem | ||
| 8/27/2023 | Price change | $560,000+14.3%$228/sqft |
Source: UtahRealEstate.com #1896904 Report a problem | ||
| 9/13/2022 | Listed for sale | $490,000-2%$200/sqft |
Source: UtahRealEstate.com #1841197 Report a problem | ||
| 9/13/2022 | Listing removed | $499,800$204/sqft |
Source: UtahRealEstate.com #1830651 Report a problem | ||
| 9/7/2022 | Price change | $499,8000%$204/sqft |
Source: UtahRealEstate.com #1830651 Report a problem | ||
| 7/24/2022 | Listed for sale | $500,000-2.9%$204/sqft |
Source: UtahRealEstate.com #1830651 Report a problem | ||
| 7/24/2022 | Listing removed | $515,000$210/sqft |
Source: UtahRealEstate.com #1822588 Report a problem | ||
| 7/12/2022 | Listed for sale | $515,000$210/sqft |
Source: UtahRealEstate.com #1822588 Report a problem | ||
| 6/28/2022 | Listing removed | $515,000$210/sqft |
Source: UtahRealEstate.com #1822588 Report a problem | ||
| 6/21/2022 | Listed for sale | $515,000$210/sqft |
Source: UtahRealEstate.com #1822588 Report a problem | ||
Public tax history
| Year | Property taxes | Tax assessment |
|---|---|---|
| 2025 | $2,771 +1.1% | $270,380 +6.1% |
| 2024 | $2,740 | $254,760 +6.7% |
| 2023 | -- | $238,865 +2.9% |
| 2022 | $2,672 +15.2% | $232,045 +24.1% |
| 2021 | $2,320 +7.4% | $187,055 +15% |
| 2020 | $2,161 +2.3% | $162,690 +4.6% |
| 2019 | $2,111 +5.1% | $155,485 +8.1% |
| 2018 | $2,009 +1.5% | $143,880 -38.9% |
| 2017 | $1,980 +9.6% | $235,300 +9.2% |
| 2016 | $1,807 +2.8% | $215,400 +14.4% |
| 2015 | $1,759 +10.4% | $188,300 +4.1% |
| 2014 | $1,594 | $180,800 +5.7% |
| 2013 | -- | $171,000 +7.7% |
| 2012 | -- | $158,800 -8.9% |
| 2011 | -- | $174,300 -5.4% |
| 2010 | -- | $184,200 -3.2% |
| 2009 | -- | $190,200 -8.3% |
| 2008 | $1,452 | $207,500 -2.1% |
| 2007 | -- | $211,900 +21.3% |
| 2006 | -- | $174,700 +10.4% |
| 2005 | -- | $158,300 +11.6% |
| 2002 | -- | $141,900 +2.4% |
| 2001 | -- | $138,600 +1.9% |
| 2000 | -- | $136,000 |
Find assessor info on the county website
Monthly payment
Climate risks
Neighborhood: 84081
Similar homes
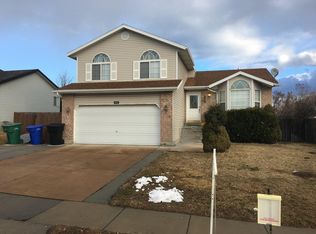
- $525,0005 bd2 ba2k sqft6450 S Clernates Dr, West Jordan, UT 84081For Sale
 MLS ID #2188769, Raquel Lee, Utah's Wise Choice Real Estate. UtahRealEstate.com
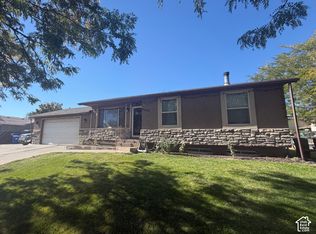
- $590,0005 bd3 ba2.3k sqft5197 W Eclipse Hill Rd, West Jordan, UT 84081For Sale
 MLS ID #2183582, Mary Joyce Hawpe, Equity Real Estate (Solid). UtahRealEstate.com
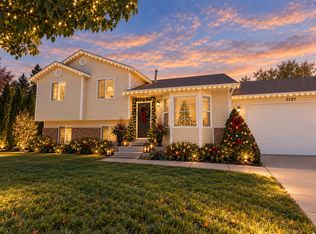
- $430,0002 bd1 ba1.9k sqft5250 W Begonia Cir, West Jordan, UT 84081For Sale
 MLS ID #2192237, Sherile L Rickman, KW South Valley Keller Williams. UtahRealEstate.com
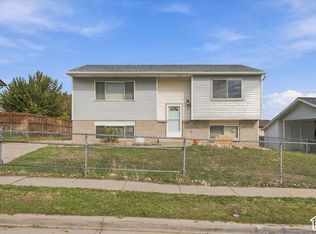
- $430,0004 bd2 ba1.7k sqft8700 S 3680 W, West Jordan, UT 84088For Sale
 MLS ID #2192489, Blake D Rounkles, Northern Realty Inc. UtahRealEstate.com
- $475,0004 bd2 ba1.2k sqft6603 S Slalom Way, West Jordan, UT 84084For SaleMLS ID #2175930, Nitesha C Armstrong, Commerce Property Solutions LLC. UtahRealEstate.com
- $700,0006 bd4 ba3.6k sqft5392 W Thresher Ct, West Jordan, UT 84081For SaleMLS ID #2192234, Ruben Gomez, KW Success Keller Williams Realty (Latino). UtahRealEstate.com
- $550,0005 bd3 ba2.3k sqft3234 W 7545 S, West Jordan, UT 84084For SaleMLS ID #2189024, Mike Ulrich, Ulrich REALTORS, Inc.. UtahRealEstate.com
- $488,0004 bd3 ba2.2k sqft4213 S 3720 W, West Valley City, UT 84120For SaleMLS ID #2166359, Scott A Dilley, Blue Diamond Realty LLC. UtahRealEstate.com
- $475,0004 bd2 ba1.9k sqft4085 W 5780 S, Salt Lake City, UT 84118For SaleMLS ID #2184062, Scott A Dilley, Blue Diamond Realty LLC. UtahRealEstate.com
- $449,9004 bd2 ba1.6k sqft6695 S Somerset Dr, West Jordan, UT 84084For SaleMLS ID #2143925, Yesenia Gonzalez, Signature Group Real Estate. UtahRealEstate.com
- $459,9004 bd2 ba2.1k sqft5363 S Ridgecrest Dr W, Salt Lake City, UT 84129For SaleMLS ID #2186215, Jaden Connor, Rockwood & Company LLC. UtahRealEstate.com
- $480,0004 bd3 ba2.2k sqft2284 W Zions Dr S, Salt Lake City, UT 84129For SaleMLS ID #2151786, Hamid Hosseini, CHASE REALTY, LLC. UtahRealEstate.com
- $594,9006 bd3 ba3.3k sqft6728 W Oak Vista Dr, West Jordan, UT 84081For SaleMLS ID #2181683, Shantelle Ericson, Ulrich REALTORS, Inc.. UtahRealEstate.com
- $459,9005 bd2 ba1.9k sqft4993 W Niagara Cir S, Salt Lake City, UT 84118For SaleMLS ID #2181303, Jacinda Allen, Ulrich REALTORS, Inc.. UtahRealEstate.com
- $499,0004 bd3 ba3.1k sqft4114 W Kirkwall Cir, South Jordan, UT 84009For SaleMLS ID #2182143, Anthony Powell, Simple Choice Real Estate. UtahRealEstate.com
- $495,0003 bd2 ba2.5k sqft6462 S Tamra Dr, Taylorsville, UT 84129For SaleMLS ID #2183679, Michael R. Cottle, Century 21 Everest (Centerville). UtahRealEstate.com
- $554,9005 bd4 ba2.2k sqft5868 S Stone Flower Way, Kearns, UT 84118For SaleMLS ID #2185227, Wade Uresk, WU Enter Real Estate, PLLC. UtahRealEstate.com
- $449,9004 bd2 ba1.6k sqft4380 W Rutgers Ave, West Valley City, UT 84120For SaleMLS ID #2189604, Binh Hue Giang, National E-Realty, LLC. UtahRealEstate.com
- $464,9005 bd2 ba2.2k sqft3590 W 4305 S, West Valley City, UT 84119For SaleMLS ID #2171479, Griselda Vitela, Presidio Real Estate (River Heights). UtahRealEstate.com
- $509,9005 bd2 ba1.9k sqft4717 S Spicewood Cir W, Salt Lake City, UT 84129For SaleMLS ID #2179903, Alen Kantarevic, Signature Group Real Estate. UtahRealEstate.com
