Home is tenanted and occupied. Please do not go to the home. Agent must coordinate access. Must have proof of funds to tour.
Active
$130,000
4843 W Beecher St, Indianapolis, IN 46241
2beds
1,164sqft
Residential, Single Family Residence
Built in 1920
9,583 Square Feet Lot
$-- Zestimate®
$112/sqft
$-- HOA
What's special
- 10 days
- 199
- 8
Likely to sell faster than
Zillow last checked:
Listing updated:
Listed by:
Aaron Reel aaronreel@gmail.com,
Athena Real Est Services,LLC
Source: MIBOR as distributed by MLS GRID,MLS#: 22120739
Facts & features
Interior
Bedrooms & bathrooms
- Bedrooms: 2
- Bathrooms: 1
- Full bathrooms: 1
- Main level bathrooms: 1
- Main level bedrooms: 2
Primary bedroom
- Level: Main
- Area: 132 Square Feet
- Dimensions: 11x12
Bedroom 2
- Level: Main
- Area: 110 Square Feet
- Dimensions: 10x11
Kitchen
- Level: Main
- Area: 120 Square Feet
- Dimensions: 12x10
Laundry
- Level: Main
- Area: 48 Square Feet
- Dimensions: 6x8
Living room
- Level: Main
- Area: 168 Square Feet
- Dimensions: 12X14
Heating
- Natural Gas
Cooling
- Central Air
Appliances
- Included: Electric Oven, Refrigerator
Features
- Has basement: No
Interior area
- Total structure area: 1,164
- Total interior livable area: 1,164 sqft
Property
Features
- Levels: One
- Stories: 1
- Patio & porch: Deck
Lot
- Size: 9,583 Square Feet
Details
- Parcel number: 491118106049000900
- Horse amenities: None
Construction
Type & style
- Home type: SingleFamily
- Architectural style: Craftsman
- Property subtype: Residential, Single Family Residence
Materials
- Wood Siding
- Foundation: Crawl Space
Condition
- New construction: No
- Year built: 1920
Utilities & green energy
- Water: Public
Community & HOA
Community
- Subdivision: Drexel Gardens
HOA
- Has HOA: No
Location
- Region: Indianapolis
Financial & listing details
- Price per square foot: $112/sqft
- Tax assessed value: $115,500
- Annual tax amount: $3,054
- Date on market: 10/9/2026
- Cumulative days on market: 11 days
Estimated market value
Not available
Estimated sales range
Not available
Not available
Price history
| Date | Event | Price |
|---|---|---|
| 10/9/2026 | Listed for sale | $130,000$112/sqft |
Source:  MIBOR as distributed by MLS GRID #22120739 Report a problem | ||
| 4/14/2023 | Listing removed | -- |
Source: Zillow Rentals Report a problem | ||
| 4/10/2023 | Listed for rent | $1,050+13.5%$1/sqft |
Source: Zillow Rentals Report a problem | ||
| 1/25/2023 | Listing removed | -- |
Source: Zillow Rentals Report a problem | ||
| 12/17/2022 | Listed for rent | $925-2.6%$1/sqft |
Source: Zillow Rentals Report a problem | ||
| 11/22/2022 | Listing removed | -- |
Source: Zillow Rental Network Premium Report a problem | ||
| 11/12/2022 | Price change | $950-5%$1/sqft |
Source: Zillow Rental Network Premium Report a problem | ||
| 10/18/2022 | Listed for rent | $1,000$1/sqft |
Source: Zillow Rental Network Premium Report a problem | ||
| 8/17/2022 | Listing removed | -- |
Source: Zillow Rental Network Premium Report a problem | ||
| 8/16/2022 | Listed for rent | $1,000+8.1%$1/sqft |
Source: Zillow Rental Network Premium Report a problem | ||
| 12/6/2021 | Listing removed | -- |
Source: Zillow Rental Network Premium Report a problem | ||
| 11/18/2021 | Listed for rent | $925$1/sqft |
Source: Zillow Rental Network Premium Report a problem | ||
Public tax history
| Year | Property taxes | Tax assessment |
|---|---|---|
| 2025 | $2,225 -1.1% | $115,500 +22% |
| 2024 | $2,250 +9.1% | $94,700 -1% |
| 2023 | $2,062 +49.4% | $95,700 +9.1% |
| 2022 | $1,380 +28.7% | $87,700 +71.6% |
| 2021 | $1,072 | $51,100 +28.7% |
| 2020 | $1,072 +0.5% | $39,700 |
| 2019 | $1,067 -1.9% | $39,700 -12.6% |
| 2018 | $1,087 -28.8% | $45,400 +1.1% |
| 2017 | $1,527 +17.5% | $44,900 -15.6% |
| 2016 | $1,300 +1087.9% | $53,200 -11.2% |
| 2014 | $109 +19.8% | $59,900 |
| 2013 | $91 | $59,900 +4% |
| 2012 | $91 | $57,600 -5.7% |
| 2011 | -- | $61,100 -1.5% |
| 2010 | $121 +2.5% | $62,000 -2.1% |
| 2009 | $118 | $63,300 -5.2% |
| 2007 | -- | $66,800 |
Find assessor info on the county website
Monthly payment
Est. payment
Payment breakdown
Explore the cost of this home by adjusting the details. Changes won't be saved.Climate risks
Neighborhood: Park Fletcher
Similar homes
- $120,0003 bd1 ba1k sqft1237 Waldemere Ave, Indianapolis, IN 46241Active
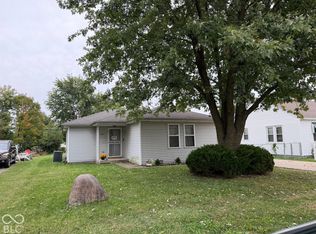 MLS ID #22120727, Aaron Reel, Athena Real Est Services,LLC. MIBOR as distributed by MLS GRID
- $140,0003 bd1 ba1k sqft3033 S Fleming St, Indianapolis, IN 46241Active
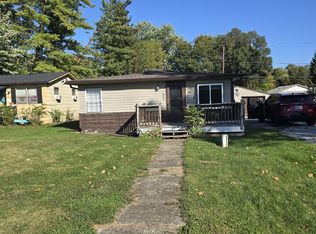 MLS ID #22130417, Matthew Jones, The Modglin Group. MIBOR as distributed by MLS GRID
- $135,0002 bd1 ba1.7k sqft2530 S Holt Rd, Indianapolis, IN 46241Active
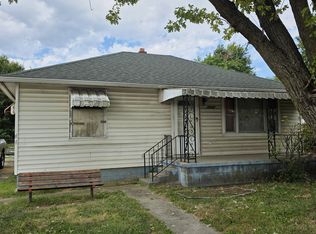 MLS ID #22125201, Keith Fields, F.C. Tucker Company. MIBOR as distributed by MLS GRID
- $160,0003 bd2 ba1k sqft1014 S Roena St, Indianapolis, IN 46241Active
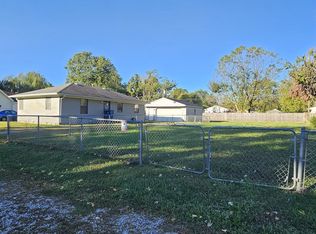 MLS ID #22132038, Misty Gears, Grace & Grit Real Estate, LLC. MIBOR as distributed by MLS GRID
- $135,0004 bd1 ba1.4k sqft409 Parkway Ave, Indianapolis, IN 46225For Sale
 MLS ID #845588, Georgeann Weisman, Brokerworks Group. NIRA as distributed by MLS GRID
