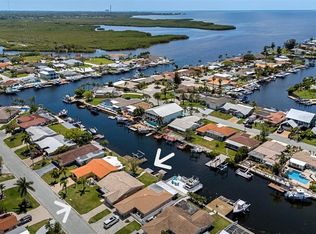
Moving to a Condo after 25 years in Gulf Harbors. For Sale by appointment only. Kitchen and baths are original and need updating. Two new 10,000 lb boat lifts installed March 2021. Newer tinted hurricane grade windows and doors throughout the home. New laminate flooring. Family room and screened porch overlooking the canal. Great location on the south channel with direct un-obstructed access to the Gulf of Mexico. From this home you can jump in your boat and literally go anywhere in the world by water. Immediate occupancy upon closing. Owner not making any repairs or guarantees as home will be sold As-Is. For showings contact the owner 586-291-1217
Pre-foreclosure
Est. $422,100
4853 Shell Stream Blvd, New Port Richey, FL 34652
3beds
1,407sqft
SingleFamily
Built in 1973
4,268 Square Feet Lot
$422,100 Zestimate®
$300/sqft
$14/mo HOA
Overview
- 29 days
- 91
- 0
Facts & features
Interior
Bedrooms & bathrooms
- Bedrooms: 3
- Bathrooms: 2
- Full bathrooms: 2
Heating
- Forced air, Electric
Cooling
- Central
Appliances
- Included: Dishwasher, Dryer, Garbage disposal, Microwave, Range / Oven, Refrigerator, Washer
Features
- Flooring: Laminate
- Basement: None
Interior area
- Total interior livable area: 1,407 sqft
Property
Parking
- Parking features: Garage - Attached, Off-street
Features
- Exterior features: Stucco, Cement / Concrete
- Has view: Yes
- View description: Water
- Has water view: Yes
- Water view: Water
Lot
- Size: 4,268 Square Feet
Details
- Parcel number: 1826160310001000210
Construction
Type & style
- Home type: SingleFamily
Materials
- Concrete Block
- Roof: Tile
Condition
- Year built: 1973
Community & HOA
HOA
- Has HOA: Yes
- HOA fee: $14 monthly
Location
- Region: New Port Richey
Financial & listing details
- Price per square foot: $300/sqft
- Tax assessed value: $364,906
- Annual tax amount: $5,789
Foreclosure details
Estimated market value
$422,100
$384,000 - $464,000
$2,122/mo
Price history
| Date | Event | Price |
|---|---|---|
| 10/10/2022 | Sold | $549,900$391/sqft |
Source: Public Record Report a problem | ||
| 9/6/2022 | Pending sale | $549,900$391/sqft |
Source:  Stellar MLS #G5052307 Report a problem | ||
| 8/24/2022 | Price change | $549,900-1.8%$391/sqft |
Source: Stellar MLS #G5052307 Report a problem | ||
| 7/18/2022 | Price change | $559,900-3.4%$398/sqft |
Source: Stellar MLS #G5052307 Report a problem | ||
| 4/12/2022 | Listed for sale | $579,900$412/sqft |
Source: Stellar MLS #G5052307 Report a problem | ||
| 3/14/2022 | Pending sale | $579,900$412/sqft |
Source: Stellar MLS #G5052307 Report a problem | ||
| 3/4/2022 | Listed for sale | $579,900+3.6%$412/sqft |
Source: Stellar MLS #G5052307 Report a problem | ||
| 3/2/2022 | Listing removed | -- |
Source: Owner Report a problem | ||
| 2/5/2022 | Listed for sale | $559,900+591.2%$398/sqft |
Source: Owner Report a problem | ||
| 5/15/1997 | Sold | $81,000$58/sqft |
Source: Public Record Report a problem | ||
Public tax history
| Year | Property taxes | Tax assessment |
|---|---|---|
| 2025 | $5,789 -5.1% | $364,906 -4.2% |
| 2024 | $6,103 -8.4% | $380,967 +2.7% |
| 2023 | $6,663 +145.3% | $370,852 +19.5% |
| 2022 | $2,716 +6.4% | $310,324 +65% |
| 2021 | $2,554 +1.7% | $188,060 +1.4% |
| 2020 | $2,511 +1.6% | $185,470 +2.3% |
| 2019 | $2,472 | $181,300 +1.9% |
| 2018 | $2,472 +2% | $177,922 +2.1% |
| 2017 | $2,423 +0.5% | $174,262 +7.2% |
| 2016 | $2,410 -13% | $162,571 +5.9% |
| 2015 | $2,771 +9.9% | $153,550 +5.9% |
| 2014 | $2,522 | $144,996 +14.9% |
| 2013 | -- | $126,180 +5.2% |
| 2012 | -- | $119,957 -11.9% |
| 2011 | -- | $136,175 +0.2% |
| 2010 | -- | $135,905 -12.7% |
| 2009 | -- | $155,675 -25.7% |
| 2008 | -- | $209,511 -5.3% |
| 2007 | -- | $221,332 -16.9% |
| 2006 | -- | $266,403 +44.1% |
| 2005 | -- | $184,928 +15.6% |
| 2004 | -- | $159,956 +20.8% |
| 2003 | -- | $132,460 +24.1% |
| 2002 | -- | $106,746 +23.3% |
| 2000 | -- | $86,601 |
| 1999 | -- | $86,601 |
Find assessor info on the county website
Monthly payment
Climate risks
Neighborhood: Flor-A-Mar
- $283,3002 bd1 ba1k sqft4857 Shell Stream Blvd, New Port Richey, FL 34652Off Market

- $315,2002 bd2 ba1.5k sqft4849 Shell Stream Blvd, New Port Richey, FL 34652Off Market
- $343,4002 bd1 ba1.1k sqft4861 Shell Stream Blvd, New Port Richey, FL 34652Off Market
- $443,1003 bd2 ba1.9k sqft4845 Shell Stream Blvd, New Port Richey, FL 34652Off Market
Similar homes
- $429,0002 bd2 ba1.4k sqft4937 DORY DRIVE, NEW PORT RICHEY, FL 34652For Sale
 MLS ID #W7890726, Evelyn Gilder, BEST OF THE GULF REALTY INC. Stellar MLS
- $450,0002 bd1 ba1k sqft5106 BLUE HERON DRIVE, NEW PORT RICHEY, FL 34652For Sale
 MLS ID #W7890688, Deborah Roy, PA, RE/MAX MARKETING SPECIALISTS. Stellar MLS
- $499,0003 bd2 ba1.4k sqft4405 FLORAMAR TERRACE, NEW PORT RICHEY, FL 34652For Sale
 MLS ID #W7890517, Judi Pobst, KELLER WILLIAMS REALTY- PALM HARBOR. Stellar MLS
- $--4 bd3 ba1.7k sqft5338 Trouble Creek Rd, New Port Richey, FL 34652Auction
 Auction.com 2
- $450,0003 bd2 ba1.6k sqft4510 RICKOVER COURT, NEW PORT RICHEY, FL 34652For SaleMLS ID #W7890014, Judi Pobst, KELLER WILLIAMS REALTY- PALM HARBOR. Stellar MLS
- $449,7773 bd3 ba1.5k sqft4237 HEADSAIL DRIVE, NEW PORT RICHEY, FL 34652For SaleMLS ID #L4961684, Chad Karr, KELLER WILLIAMS REALTY. Stellar MLS
- $425,0002 bd2 ba986 sqft4821 FLORAMAR TERRACE, NEW PORT RICHEY, FL 34652For SaleMLS ID #TB8550422, Jakea Cates, KELLER WILLIAMS REALTY- PALM HARBOR. Stellar MLS
- $525,0002 bd2 ba1.3k sqft4532 FLORAMAR TERRACE, NEW PORT RICHEY, FL 34652For SaleMLS ID #W7890510, Judi Pobst, KELLER WILLIAMS REALTY- PALM HARBOR. Stellar MLS
- $375,0002 bd2 ba1.1k sqft4865 SHELL STREAM BOULEVARD, NEW PORT RICHEY, FL 34652For SaleMLS ID #TB8552354, Natalie Thompson, MARK SPAIN REAL ESTATE. Stellar MLS
- $489,7773 bd2 ba1.6k sqft4930 POMPANO DRIVE, NEW PORT RICHEY, FL 34652For SaleMLS ID #L4963469, Chad Karr, KELLER WILLIAMS REALTY. Stellar MLS
- $465,0003 bd2 ba1.2k sqft4234 FLORAMAR TERRACE, NEW PORT RICHEY, FL 34652For SaleMLS ID #TB8513495, Kelly Nguyen, KELLER WILLIAMS TAMPA PROPERTIES. Stellar MLS
- $280,0003 bd2 ba1.1k sqft5330 POINSETTIA DRIVE, NEW PORT RICHEY, FL 34652For SaleMLS ID #TB8563339, Otniel Mojarrieta, JPT REALTY LLC. Stellar MLS
- $484,0003 bd2 ba1.8k sqft4933 SHELL STREAM BOULEVARD, NEW PORT RICHEY, FL 34652For SaleMLS ID #W7888919, Judi Pobst, KELLER WILLIAMS REALTY- PALM HARBOR. Stellar MLS
- $430,0002 bd1 ba1.1k sqft4320 FLORAMAR TERRACE, NEW PORT RICHEY, FL 34652For SaleMLS ID #TB8526465, Teri Kelly, KELLY REALTY GROUP LLC. Stellar MLS
- $485,0002 bd2 ba1.5k sqft4920 PELICAN DRIVE, NEW PORT RICHEY, FL 34652For SaleMLS ID #W7889046, Ashley Quaife, RE/MAX CHAMPIONS. Stellar MLS
- $349,9003 bd2 ba1.7k sqft4521 EDITH STREET, NEW PORT RICHEY, FL 34652For SaleMLS ID #W7888212, Allan Safranek, III, RICHEY REALTY. Stellar MLS
- $350,0002 bd1 ba927 sqft4351 FLORAMAR TERRACE, NEW PORT RICHEY, FL 34652For SaleMLS ID #W7890715, Jeannie Dunning, RE/MAX CHAMPIONS. Stellar MLS
- $519,0002 bd2 ba1.6k sqft4916 POMPANO DRIVE, NEW PORT RICHEY, FL 34652For SaleMLS ID #TB8549154, Vanessa Leonard, KELLER WILLIAMS REALTY- PALM HARBOR. Stellar MLS
- $349,9992 bd2 ba1k sqft4611 TOPSAIL TRAIL, NEW PORT RICHEY, FL 34652For SaleMLS ID #W7889416, Judi Pobst, KELLER WILLIAMS REALTY- PALM HARBOR. Stellar MLS
- $419,0002 bd2 ba1.3k sqft3931 HEADSAIL DRIVE, NEW PORT RICHEY, FL 34652For SaleMLS ID #TB8488804, Ron Morris, Jr, RE/MAX ELITE REALTY. Stellar MLS
