Single Family home located in Bottomwoods, on an oversize lot close to water, great investment opportunity. Bring your vision and unlock value, this porperty is ideal for buyers looking to renovate and build equity. features Vinyl windows and updated kitchen cabinets.
Active
$329,900
49 Tarleton St, Warwick, RI 02889
2beds
1,117sqft
Single Family Residence
Built in 1950
7,840 Square Feet Lot
$-- Zestimate®
$295/sqft
$-- HOA
What's special
Close to waterUpdated kitchen cabinetsOversize lotVinyl windows
- 1 day
- 564
- 22
Zillow last checked:
Listing updated:
Listed by:
Antoanet Sialer 401-640-3299,
Prime Time Properties, Inc.
Source: StateWide MLS RI,MLS#: 1428563
Facts & features
Interior
Bedrooms & bathrooms
- Bedrooms: 2
- Bathrooms: 1
- Full bathrooms: 1
Bathroom
- Features: Bath w Tub
Heating
- Oil, Baseboard, None
Cooling
- None
Appliances
- Included: Electric Water Heater
Features
- Wall (Cermaic), Wall (Dry Wall)
- Flooring: Ceramic Tile, Hardwood
- Basement: Full,Interior and Exterior,Unfinished
- Number of fireplaces: 1
- Fireplace features: Brick
Interior area
- Total structure area: 1,117
- Total interior livable area: 1,117 sqft
- Finished area above ground: 1,117
- Finished area below ground: 0
Video & virtual tour
Property
Parking
- Total spaces: 4
- Parking features: Attached
- Attached garage spaces: 1
Lot
- Size: 7,840 Square Feet
Details
- Parcel number: WARWM360B0754L0000
Construction
Type & style
- Home type: SingleFamily
- Architectural style: Cape Cod
- Property subtype: Single Family Residence
Materials
- Ceramic, Dry Wall, Vinyl Siding
- Foundation: Block
Condition
- New construction: No
- Year built: 1950
Utilities & green energy
- Electric: 100 Amp Service
- Sewer: Public Sewer
- Water: Public
Community & HOA
Community
- Subdivision: Bottomwoods
HOA
- Has HOA: No
Location
- Region: Warwick
Financial & listing details
- Price per square foot: $295/sqft
- Tax assessed value: $238,900
- Annual tax amount: $4,058
- Date on market: 11/15/2026
Estimated market value
Not available
Estimated sales range
Not available
$2,568/mo
Price history
| Date | Event | Price |
|---|---|---|
| 11/15/2026 | Listed for sale | $329,900+17.4%$295/sqft |
Source:  StateWide MLS RI #1428563 Report a problem | ||
| 7/24/2026 | Sold | $281,000+15580.8%$252/sqft |
Source: Public Record Report a problem | ||
| 6/23/2026 | Sold | $1,792$2/sqft |
Source: Public Record Report a problem | ||
Public tax history
| Year | Property taxes | Tax assessment |
|---|---|---|
| 2025 | $3,457 | $238,900 |
| 2024 | $3,457 +2% | $238,900 |
| 2023 | $3,390 +12.8% | $238,900 +48.9% |
| 2022 | $3,004 | $160,400 |
| 2021 | $3,004 | $160,400 |
| 2020 | $3,004 | $160,400 |
| 2019 | $3,004 +2% | $160,400 +13.3% |
| 2018 | $2,945 +2.8% | $141,600 |
| 2017 | $2,866 | $141,600 |
| 2016 | $2,866 +6% | $141,600 +8.7% |
| 2015 | $2,704 +3.4% | $130,300 |
| 2014 | $2,614 +1.4% | $130,300 |
| 2013 | $2,579 +1.5% | $130,300 -9.3% |
| 2011 | $2,542 +1.2% | $143,700 |
| 2010 | $2,512 -14.4% | $143,700 -30.7% |
| 2009 | $2,933 +5.5% | $207,400 |
| 2008 | $2,781 +19.3% | $207,400 +37.5% |
| 2007 | $2,331 | $150,800 |
| 2006 | $2,331 +4.4% | $150,800 |
| 2004 | $2,233 -5.7% | $150,800 +77.2% |
| 2003 | $2,369 | $85,110 |
Find assessor info on the county website
Monthly payment
Est. payment
Payment breakdown
Explore the cost of this home by adjusting the details. Changes won't be saved.Climate risks
Neighborhood: 02889


Similar homes
- $--2 bd1 ba1k sqft109 Pequot Ave, Warwick, RI 02889Auction
 Auction.com 2
- $324,9003 bd1 ba960 sqft20 Orrin St, Warwick, RI 02889For Sale
 MLS ID #12028850, Rachel Sanville, Your Home Sold Guaranteed Realty, The Nathan Clark Team. My State MLS
- $384,9003 bd2 ba1k sqft52 Heights Ave, Warwick, RI 02889For Sale
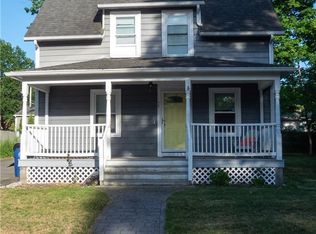
 MLS ID #1428351, Susan Baccari, Residential Properties Ltd.. StateWide MLS RI
- $--3 bd2 ba1.2k sqft200 Diamond Hill Rd, Warwick, RI 02886Auction
 Auction.com 2
- $349,0003 bd2 ba1.3k sqft19 Deborah Rd, Warwick, RI 02888For SaleMLS ID #1428103, Stephen Antoni, Mott & Chace Sotheby's Intl.. StateWide MLS RI
- $399,9003 bd1 ba1.3k sqft24 Steele Ave, Warwick, RI 02889For SaleMLS ID #1428345, Kiersten Luis, Mako Realty. StateWide MLS RI
- $329,9002 bd1 ba616 sqft103 Darrow Dr, Warwick, RI 02886For SaleMLS ID #1423835, Gayle Moone, Real Estate Masters, Inc.. StateWide MLS RI
- $425,0004 bd1 ba1.3k sqft76 Novelty Rd, Warwick, RI 02889For SaleMLS ID #1427362, Milko Ugarte, Realty Center. StateWide MLS RI
- $225,0003 bd2 ba1.3k sqft131 Park Ave, Warwick, RI 02889For SaleMLS ID #1428114, Chelsea Clark, REMAX Revolution. StateWide MLS RI
- $385,0003 bd1 ba1k sqft97 Keeley Ave, Warwick, RI 02886For SaleMLS ID #1426641, Jennifer Eaton, Ocean Roads Realty LLC. StateWide MLS RI
- $389,9004 bd2 ba1.6k sqft69 Lyall Ave, Warwick, RI 02889For SaleMLS ID #1426647, Jim Silberman, RE/MAX Professionals. StateWide MLS RI
- $349,9003 bd1 ba864 sqft3086 Post Rd, Warwick, RI 02886For SaleMLS ID #1427388, Michael Pinelli, RE/MAX Preferred. StateWide MLS RI
- $209,9002 bd1 ba614 sqft165 Canfield Ave, Warwick, RI 02889New ConstructionMLS ID #1422320, Tammy Pelletier, REMAX Revolution. StateWide MLS RI
- $339,9004 bd1 ba1.2k sqft4 Oriole Ave, West Warwick, RI 02893For SaleMLS ID #1427872, James Luth, HERE Realty. StateWide MLS RI
- $399,9003 bd1 ba1.2k sqft22 Cooke Pl, Warwick, RI 02888For SaleMLS ID #1427875, Angelo Greco, Greco Real Estate. StateWide MLS RI
- $479,9004 bd3 ba1.5k sqft58 Surf Ave, Warwick, RI 02889For SaleMLS ID #1427506, Michael Cabeceiras, RE/MAX ONE. StateWide MLS RI
