Loudermark Rentals represents a methodically assembled portfolio of 25 properties — 35 total rentable doors — across Lubbock, Texas. Every unit is currently rented and cash-flowing. These are well-maintained, tenant-occupied homes and units with established rental histories in a supply-constrained secondary market. This is not a collection of distressed assets or a value-add project in search of an operator: it is a stabilized, professionally managed portfolio ready to transfer income on day one, offered at $4,200,000.
For sale
$165,000
5011 42nd St, Lubbock, TX 79414
3beds
1,407sqft
Single Family Residence, Residential
Built in 1959
7,405 Square Feet Lot
$161,200 Zestimate®
$117/sqft
$-- HOA
What's special
- 18 days
- 229
- 17
Likely to sell faster than
Zillow last checked:
Listing updated:
Listed by:
Mark Murray TREC #0590317 806-831-8436,
Reside Real Estate Co.
Source: LBMLS,MLS#: 202614171
Facts & features
Interior
Bedrooms & bathrooms
- Bedrooms: 3
- Bathrooms: 2
- Full bathrooms: 2
Heating
- Central
Cooling
- Ceiling Fan(s), Central Air
Features
- Ceiling Fan(s)
- Has fireplace: No
Interior area
- Total structure area: 1,407
- Total interior livable area: 1,407 sqft
- Finished area above ground: 1,407
Property
Parking
- Total spaces: 1
- Parking features: Attached, Garage, See Remarks
- Attached garage spaces: 1
Features
- Exterior features: Other
- Fencing: Back Yard
Lot
- Size: 7,405 Square Feet
Details
- Parcel number: R72530
Construction
Type & style
- Home type: SingleFamily
- Property subtype: Single Family Residence, Residential
Materials
- Brick Veneer
- Foundation: Pillar/Post/Pier
- Roof: Composition
Condition
- New construction: No
- Year built: 1959
Community & HOA
Community
- Security: See Remarks
Location
- Region: Lubbock
Financial & listing details
- Price per square foot: $117/sqft
- Tax assessed value: $130,044
- Annual tax amount: $2,477
- Date on market: 10/15/2026
- Listing terms: Cash,Conventional,VA Loan
- Road surface type: Paved
Estimated market value
$161,200
$153,000 - $169,000
$1,239/mo
Price history
| Date | Event | Price |
|---|---|---|
| 10/15/2026 | Listed for sale | $165,000+121.5%$117/sqft |
Source:  LBMLS #202614171 Report a problem | ||
| 4/26/2026 | Listing removed | $995$1/sqft |
Source: Zillow Rentals Report a problem | ||
| 4/20/2026 | Price change | $995-20.1%$1/sqft |
Source: Zillow Rentals Report a problem | ||
| 3/30/2026 | Price change | $1,245-3.9%$1/sqft |
Source: Zillow Rentals Report a problem | ||
| 2/10/2026 | Listed for rent | $1,295+8.4%$1/sqft |
Source: Zillow Rentals Report a problem | ||
| 9/11/2025 | Listing removed | $1,195$1/sqft |
Source: Zillow Rentals Report a problem | ||
| 8/29/2025 | Listed for rent | $1,195+9.1%$1/sqft |
Source: Zillow Rentals Report a problem | ||
| 10/3/2024 | Listing removed | $1,095-8.4%$1/sqft |
Source: Zillow Rentals Report a problem | ||
| 9/19/2024 | Price change | $1,195-7.7%$1/sqft |
Source: Zillow Rentals Report a problem | ||
| 8/1/2024 | Listed for rent | $1,295$1/sqft |
Source: Zillow Rentals Report a problem | ||
| 8/18/2023 | Listing removed | -- |
Source: Zillow Rentals Report a problem | ||
| 6/28/2023 | Listed for rent | $1,295$1/sqft |
Source: Zillow Rentals Report a problem | ||
| 9/13/2021 | Listing removed | -- |
Source: Zillow Rental Manager Report a problem | ||
| 9/7/2021 | Listed for rent | $1,295$1/sqft |
Source: Zillow Rental Manager Report a problem | ||
| 6/3/2011 | Sold | -- |
Source: Agent Provided Report a problem | ||
| 5/22/2011 | Pending sale | $74,500$53/sqft |
Source: Keller Williams - Lubbock #9979081 Report a problem | ||
Public tax history
| Year | Property taxes | Tax assessment |
|---|---|---|
| 2026 | -- | $130,044 -7.1% |
| 2025 | $2,477 -3.3% | $140,000 -7.4% |
| 2024 | $2,561 +5.9% | $151,117 +8.4% |
| 2023 | $2,418 -13.3% | $139,349 +1.1% |
| 2022 | $2,789 +9.5% | $137,780 +15.1% |
| 2021 | $2,547 +5.6% | $119,735 +6.3% |
| 2020 | $2,412 +8.1% | $112,603 +9.7% |
| 2019 | $2,231 +9.7% | $102,618 +3.6% |
| 2018 | $2,034 | $99,052 +9.5% |
| 2017 | $2,034 +11.8% | $90,494 |
| 2016 | $1,819 | $90,494 +11.7% |
| 2015 | $1,819 | $81,030 -0.9% |
| 2014 | $1,819 | $81,791 +5% |
| 2013 | -- | $77,870 |
| 2012 | -- | $77,870 |
| 2011 | -- | $77,870 |
| 2010 | -- | $77,870 |
| 2009 | -- | $77,870 |
| 2008 | -- | $77,870 +8.3% |
| 2007 | -- | $71,896 |
| 2006 | -- | $71,896 |
| 2005 | -- | $71,896 +15.5% |
| 2004 | -- | $62,268 |
| 2003 | -- | $62,268 +8% |
| 2002 | $1,430 +11% | $57,674 +10.8% |
| 2001 | $1,288 +0.7% | $52,034 |
| 2000 | $1,279 | $52,034 |
Find assessor info on the county website
Monthly payment
Est. payment
Payment breakdown
Explore the cost of this home by adjusting the details. Changes won't be saved.Climate risks
Neighborhood: Stubbs-Stewart

Similar homes
- $172,5003 bd2 ba1.5k sqft5401 42nd St, Lubbock, TX 79414For Sale
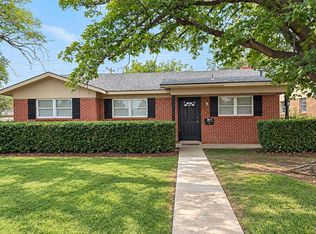 MLS ID #202614765, Brandi Longoria, Perched Real Estate Company. LBMLS
- $179,5003 bd2 ba1.1k sqft5109 41st St, Lubbock, TX 79414For Sale
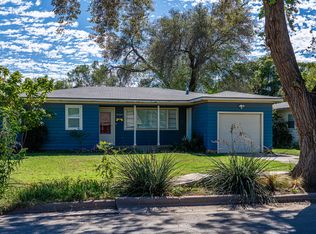 MLS ID #202614468, Philip Bales, Our Texas Real Estate Group. LBMLS
- $--3 bd2 ba1.1k sqft5117 47th St, Lubbock, TX 79414Auction
 Auction.com 2
- $177,5003 bd2 ba1.4k sqft5424 41st St, Lubbock, TX 79414For Sale
 MLS ID #202614601, Ryan Robertson, Better Homes and Gardens. LBMLS
