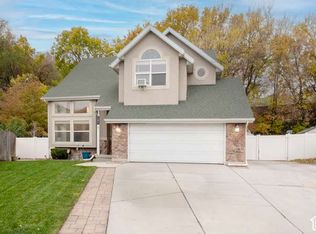
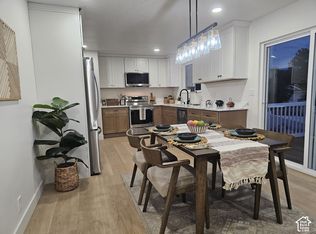
This 2115 square foot single family home has 6 bedrooms and 3.25 bathrooms. This home is located at 5055 S Clover View Dr, Murray, UT 84123.
Pre-foreclosure
Street View
Est. $754,900
5055 S Clover View Dr, Murray, UT 84123
6beds
3baths
2,115sqft
SingleFamily
Built in 1977
10,454 Square Feet Lot
$754,900 Zestimate®
$357/sqft
$-- HOA
Overview
- 77 days
- 6
- 0
Facts & features
Interior
Bedrooms & bathrooms
- Bedrooms: 6
- Bathrooms: 3.25
Heating
- Radiant
Cooling
- Central
Features
- Basement: Finished
- Has fireplace: Yes
Interior area
- Total interior livable area: 2,115 sqft
Property
Parking
- Parking features: Garage - Attached
Features
- Exterior features: Brick
Lot
- Size: 10,454 Square Feet
Details
- Parcel number: 21121780010000
Construction
Type & style
- Home type: SingleFamily
Materials
- brick
- Roof: Asphalt
Condition
- Year built: 1977
Community & HOA
Location
- Region: Murray
Financial & listing details
- Price per square foot: $357/sqft
- Tax assessed value: $765,700
- Annual tax amount: $3,384
Foreclosure details
Estimated market value
$754,900
$710,000 - $808,000
$4,234/mo
Price history
| Date | Event | Price |
|---|---|---|
| 2/26/2024 | Pending sale | $760,000$359/sqft |
Source:  UtahRealEstate.com #1893816 Report a problem | ||
| 1/26/2024 | Listed for sale | $760,000$359/sqft |
Source: UtahRealEstate.com #1893816 Report a problem | ||
| 1/10/2024 | Pending sale | $760,000$359/sqft |
Source: UtahRealEstate.com #1893816 Report a problem | ||
| 11/29/2023 | Price change | $760,000-1.9%$359/sqft |
Source: UtahRealEstate.com #1893816 Report a problem | ||
| 11/10/2023 | Price change | $775,000-3%$366/sqft |
Source: UtahRealEstate.com #1893816 Report a problem | ||
| 8/10/2023 | Listed for sale | $799,000$378/sqft |
Source: UtahRealEstate.com #1893816 Report a problem | ||
| 2/10/2011 | Sold | -- |
Source: Public Record Report a problem | ||
| 11/19/2010 | Sold | -- |
Source: Public Record Report a problem | ||
Public tax history
| Year | Property taxes | Tax assessment |
|---|---|---|
| 2025 | $3,384 +40.3% | $421,135 +43.1% |
| 2024 | $2,412 -3% | $294,250 +1.3% |
| 2023 | $2,486 -7.6% | $290,455 -2.9% |
| 2022 | $2,692 +14.6% | $298,980 +29.9% |
| 2021 | $2,350 +1.9% | $230,175 +7.7% |
| 2020 | $2,305 +3% | $213,675 +6.6% |
| 2019 | $2,238 +1.2% | $200,420 -1.7% |
| 2018 | $2,212 -0.8% | $203,830 -33.5% |
| 2017 | $2,230 +21.9% | $306,600 +19.1% |
| 2016 | $1,830 +15% | $257,500 +1.9% |
| 2015 | $1,592 -7.5% | $252,700 +4.7% |
| 2014 | $1,720 | $241,400 +5.6% |
| 2013 | -- | $228,500 +3.5% |
| 2012 | -- | $220,700 -12.1% |
| 2011 | -- | $251,000 -5.4% |
| 2010 | -- | $265,200 -3% |
| 2009 | -- | $273,500 -10.7% |
| 2008 | $1,483 | $306,300 -4.3% |
| 2007 | -- | $319,900 +35.3% |
| 2006 | -- | $236,400 +10.4% |
| 2005 | -- | $214,100 +16.4% |
| 2002 | -- | $183,900 +0.5% |
| 2001 | -- | $183,000 +6.6% |
| 2000 | -- | $171,700 |
Find assessor info on the county website
Monthly payment
Climate risks
Neighborhood: 84123
Similar homes
- $--4 bd1 ba1.2k sqft4880 S Pinewood Dr, Taylorsville, UT 84123AuctionServiceLink Auction
- $615,0005 bd4 ba2.5k sqft1271 W Springshire Ln, Murray, UT 84123For Sale
 MLS ID #2195829, Rod Packer, KW Ascend Keller Williams Realty. UtahRealEstate.com
- $699,0005 bd3 ba2.7k sqft6190 S Eagle Nest Dr, Murray, UT 84123For Sale
 MLS ID #2194646, Linda Burtch, KW Utah Realtors Keller Williams (Brickyard). UtahRealEstate.com
- $635,0006 bd2 ba2.3k sqft995 W River Point Cir, Murray, UT 84123For Sale
 MLS ID #2188477, Victor Rothaar, Ultimate Homes of Utah LLC. UtahRealEstate.com
- $719,0004 bd3 ba2.5k sqft4857 S Taylors Park Dr, Salt Lake City, UT 84123For SaleMLS ID #2188730, Candace Chatham, Real Broker, LLC. UtahRealEstate.com
- $630,0005 bd3 ba2.5k sqft808 W Bullion St, Murray, UT 84123For SaleMLS ID #2173374, Kris A. Hudson, X FACTOR REAL ESTATE, LLC. UtahRealEstate.com
- $675,0004 bd4 ba2.3k sqft5438 S Brandonwood Dr, Murray, UT 84123For SaleMLS ID #2186089, Corina F Munoz, Signature Group Real Estate. UtahRealEstate.com
- $629,9004 bd4 ba2k sqft5620 S Goodway Dr W, Salt Lake City, UT 84123For SaleMLS ID #2194958, Dane Kania, Connect Fast Realty, LLC. UtahRealEstate.com
- $525,0004 bd2 ba3.1k sqft725 W 4060 S, Murray, UT 84123For SaleMLS ID #2196912, Emily Brace, KW Utah Realtors Keller Williams (Brickyard). UtahRealEstate.com
- $600,0005 bd3 ba2.5k sqft942 W Riverbend Dr, Murray, UT 84123For SaleMLS ID #2190965, Michelle Todd, Realtypath LLC (South Valley). UtahRealEstate.com
- $624,9005 bd3 ba2.4k sqft910 W Brandermill Cv, Murray, UT 84123For SaleMLS ID #2146671, Khitam Saffah, Equity Real Estate (Solid). UtahRealEstate.com
- $649,9004 bd4 ba2.8k sqft5554 S Edgeberry Dr, Murray, UT 84123For SaleMLS ID #2184116, Kenneth Maddy, Equity Real Estate (Advantage). UtahRealEstate.com
- $729,9005 bd3 ba2.3k sqft4260 S Normandie Ln, Millcreek, UT 84107For SaleMLS ID #2177317, Sam Gnanasundaram, Realtypath LLC. UtahRealEstate.com
- $634,0004 bd4 ba2.8k sqft5668 S 1090 W, Murray, UT 84123For SaleMLS ID #2183363, Shauna Quick, EXIT Realty Success. UtahRealEstate.com
- $530,0004 bd2 ba1.7k sqft940 W Potomac Dr, Murray, UT 84123For SaleMLS ID #2195837, Rachel Kitterer, Chapman-Richards & Associates, Inc.. UtahRealEstate.com
- $570,0005 bd3 ba2.1k sqft548 W 5900 S, Murray, UT 84123For SaleMLS ID #2159944, Kevin C Warren, Real Broker, LLC. UtahRealEstate.com
- $750,0005 bd3 ba2.3k sqft4620 S Namba Way E #101, Salt Lake City, UT 84107For SaleMLS ID #2147199, Joyce Hughes, Utah's Wise Choice Real Estate. UtahRealEstate.com
- $565,0004 bd3 ba1.9k sqft5928 S Chesapeake Cir W, Salt Lake City, UT 84123For SaleMLS ID #2187016, Rachel Wray Eliason, KW Utah Realtors Keller Williams. UtahRealEstate.com
- $769,9004 bd3 ba2.8k sqft5767 S Tripp Ln W, Salt Lake City, UT 84123For SaleMLS ID #2190755, Dave Galvan, Certified Real Estate Services LLC. UtahRealEstate.com
- $769,9004 bd3 ba2.8k sqft5803 S Tripp Ln, Salt Lake City, UT 84123For SaleMLS ID #2190752, Dave Galvan, Certified Real Estate Services LLC. UtahRealEstate.com
