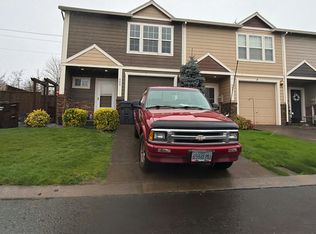
This 2698 square foot multi family home has 6 bedrooms and 4.0 bathrooms. This home is located at 516 S Maple St, Canby, OR 97013.
Pre-foreclosure
Street View
Est. $661,600
516 S Maple St, Canby, OR 97013
6beds
4baths
2,698sqft
MultiFamily
Built in 1986
-- sqft lot
$661,600 Zestimate®
$245/sqft
$-- HOA
Overview
- 85 days |
- 19 |
- 0 |
Facts & features
Interior
Bedrooms & bathrooms
- Bedrooms: 6
- Bathrooms: 4
Interior area
- Total interior livable area: 2,698 sqft
Property
Details
- Parcel number: 00797702
Construction
Type & style
- Home type: MultiFamily
Condition
- Year built: 1986
Community & HOA
Location
- Region: Canby
Financial & listing details
- Price per square foot: $245/sqft
- Tax assessed value: $596,928
- Annual tax amount: $5,081
Visit our professional directory to find a foreclosure specialist in your area that can help with your home search.
Find a foreclosure agentForeclosure details
Estimated market value
$661,600
$615,000 - $708,000
$2,269/mo
Price history
| Date | Event | Price |
|---|---|---|
| 12/16/2005 | Sold | $338,500+11%$125/sqft |
Source: Public Record Report a problem | ||
| 10/28/2004 | Sold | $305,000$113/sqft |
Source: Public Record Report a problem | ||
Public tax history
| Year | Property taxes | Tax assessment |
|---|---|---|
| 2025 | $5,081 -11.8% | $286,779 +3% |
| 2024 | $5,759 +5% | $278,427 +3% |
| 2023 | $5,486 +6.3% | $270,318 +3% |
| 2022 | $5,160 +3.4% | $262,445 +3% |
| 2021 | $4,992 +0.2% | $254,801 +3% |
| 2020 | $4,980 -0.8% | $247,380 +3% |
| 2019 | $5,019 +25.5% | $240,175 +3% |
| 2018 | $4,000 | $233,180 +3% |
| 2017 | $4,000 -35.4% | $226,388 +3% |
| 2016 | $6,188 | $219,794 +3% |
| 2015 | $6,188 +70.1% | $213,392 +3% |
| 2014 | $3,639 +5.9% | $207,177 +3% |
| 2013 | $3,437 +3.3% | $201,143 +3% |
| 2012 | $3,328 +3% | $195,284 +3% |
| 2011 | $3,231 +2.8% | $189,596 +3% |
| 2010 | $3,143 +2.6% | $184,074 +3% |
| 2009 | $3,062 +7.8% | $178,713 +3% |
| 2008 | $2,841 +2.4% | $173,508 +3% |
| 2007 | $2,775 +4.1% | $168,454 +3% |
| 2006 | $2,666 -0.5% | $163,548 +3% |
| 2005 | $2,680 +1.5% | $158,784 +3% |
| 2004 | $2,640 +2.5% | $154,159 +3% |
| 2003 | $2,577 +3.6% | $149,669 +3% |
| 2002 | $2,486 +3.3% | $145,310 +3% |
| 2001 | $2,408 +3.8% | $141,078 +3% |
| 2000 | $2,320 | $136,969 |
Find assessor info on the county website
Monthly payment
Estimated monthly payment$1,822
All calculations are estimates and provided by Zillow, Inc. for informational purposes only. Actual amounts may vary.
HOA fees may include property taxes on listings classified as Co-Ops. Contact the listing agent and/or owner for fee details.
Mortgage interest rates are dependent on a number of factors, including credit score, down payment, and repayment length. Interest rate data provided by Zillow Group Marketplace, Inc. as of 1/1/1970 from various mortgage lenders with which we have lead or other similar arrangements; the Estimated Payment is an average of those rates.
See how much you could borrow to make a competitive offer.
Climate risks
Neighborhood: 97013
Nearby schools
GreatSchools rating
- 8/10Carus SchoolGrades: K-6Distance: 5.5 mi
- 3/10Baker Prairie Middle SchoolGrades: 7-8Distance: 0.6 mi
- 7/10Canby High SchoolGrades: 9-12Distance: 0.9 mi


- Oregon
- Clackamas County
- Canby
- 97013
- 516 S Maple St
Nearby cities
Nearby zip codes
Other Canby Topics
