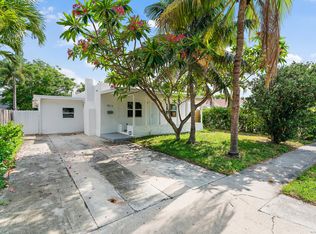
This 1340 square foot single family home has 2 bedrooms and 2.0 bathrooms. This home is located at 517 Franklin Rd, West Palm Beach, FL 33405.
Pre-foreclosure
Street View
Est. $390,600
517 Franklin Rd, West Palm Beach, FL 33405
2beds
2baths
1,340sqft
SingleFamily
Built in 2001
5,488 Square Feet Lot
$390,600 Zestimate®
$291/sqft
$-- HOA
Overview
- 271 days |
- 17 |
- 0 |
Facts & features
Interior
Bedrooms & bathrooms
- Bedrooms: 2
- Bathrooms: 2
Heating
- Forced air
Cooling
- Central
Features
- Flooring: Other, Hardwood
Interior area
- Total interior livable area: 1,340 sqft
Property
Features
- Exterior features: Stucco
Lot
- Size: 5,488 Square Feet
Details
- Parcel number: 74434404040170170
Construction
Type & style
- Home type: SingleFamily
Materials
- masonry
- Roof: Asphalt
Condition
- Year built: 2001
Community & HOA
Location
- Region: West Palm Beach
Financial & listing details
- Price per square foot: $291/sqft
- Tax assessed value: $341,446
- Annual tax amount: $1,119
Visit our professional directory to find a foreclosure specialist in your area that can help with your home search.
Find a foreclosure agentForeclosure details
Estimated market value
$390,600
$359,000 - $422,000
$3,598/mo
Price history
| Date | Event | Price |
|---|---|---|
| 9/5/2001 | Sold | $103,000+368.2%$77/sqft |
Source: Public Record Report a problem | ||
| 12/15/1999 | Sold | $22,000$16/sqft |
Source: Public Record Report a problem | ||
Public tax history
| Year | Property taxes | Tax assessment |
|---|---|---|
| 2025 | $1,119 +4.5% | $82,606 +2.9% |
| 2024 | $1,071 +4.5% | $80,278 +3% |
| 2023 | $1,025 +3.7% | $77,940 +3% |
| 2022 | $988 +0.5% | $75,670 +3% |
| 2021 | $983 +0.3% | $73,466 +1.4% |
| 2020 | $980 +0.1% | $72,452 +2.3% |
| 2019 | $979 | $70,823 +1.9% |
| 2018 | $979 +9.4% | $69,502 +2.1% |
| 2017 | $894 +3% | $68,072 +2.1% |
| 2016 | $868 -0.6% | $66,672 +0.7% |
| 2015 | $873 -3% | $66,209 +0.8% |
| 2014 | $901 +0.8% | $65,684 +1.5% |
| 2013 | $894 -0.2% | $64,713 +1.7% |
| 2012 | $896 -19.6% | $63,631 -20.3% |
| 2011 | $1,114 -2.1% | $79,881 -1% |
| 2010 | $1,138 -20.9% | $80,691 -15.1% |
| 2009 | $1,438 +10.8% | $95,014 +0.1% |
| 2008 | $1,298 -15.3% | $94,919 +3% |
| 2007 | $1,533 -4.8% | $92,154 +2.5% |
| 2006 | $1,611 | $89,906 +3% |
| 2005 | -- | $87,287 +3% |
| 2004 | $913 +778.3% | $84,745 +1.9% |
| 2003 | $104 -93% | $83,165 +2.4% |
| 2002 | $1,488 +341.6% | $81,216 |
| 2001 | $337 +49.8% | -- |
| 2000 | $225 +0.7% | -- |
| 1999 | $223 | $8,970 |
Find assessor info on the county website
Monthly payment
Estimated monthly payment$1,822
All calculations are estimates and provided by Zillow, Inc. for informational purposes only. Actual amounts may vary.
HOA fees may include property taxes on listings classified as Co-Ops. Contact the listing agent and/or owner for fee details.
Mortgage interest rates are dependent on a number of factors, including credit score, down payment, and repayment length. Interest rate data provided by Zillow Group Marketplace, Inc. as of 1/1/1970 from various mortgage lenders with which we have lead or other similar arrangements; the Estimated Payment is an average of those rates.
See how much you could borrow to make a competitive offer.
Climate risks
Neighborhood: South Side
Nearby schools
GreatSchools rating
- 7/10South Olive Elementary SchoolGrades: PK-5Distance: 0.5 mi
- 4/10Conniston Middle SchoolGrades: 6-8Distance: 1.4 mi
- 3/10Forest Hill Community High SchoolGrades: 9-12Distance: 0.6 mi


- Florida
- Palm Beach County
- West Palm Beach
- 33405
- South Side
- 517 Franklin Rd
Nearby cities
Nearby neighborhoods
Nearby zip codes
Other West Palm Beach Topics
