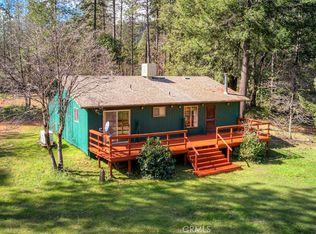
This 1282 square foot single family home has 3 bedrooms and 1.0 bathrooms. This home is located at 52 Fox Hill Rd, Berry Creek, CA 95916.
Pre-foreclosure
Street View
Est. $319,000
52 Fox Hill Rd, Berry Creek, CA 95916
3beds
1,282sqft
SingleFamily
Built in 1978
5 Acres Lot
$319,000 Zestimate®
$249/sqft
$-- HOA
Overview
- 136 days |
- 69 |
- 0 |
Facts & features
Interior
Bedrooms & bathrooms
- Bedrooms: 3
- Bathrooms: 1
- Full bathrooms: 1
Heating
- Forced air, Electric
Cooling
- None
Appliances
- Included: Dryer, Range / Oven, Washer
- Laundry: Laundry Closet
Features
- Flooring: Tile, Carpet
- Has fireplace: Yes
- Fireplace features: Wood Burning, Brick, Stone, Living Room, Master Bedroom
Interior area
- Structure area source: Not Verified
- Total interior livable area: 1,282 sqft
Property
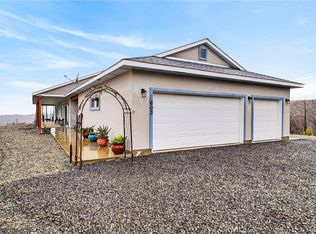
Parking
- Total spaces: 2
- Parking features: Garage - Detached
Features
- Exterior features: Wood
Lot
- Size: 5 Acres
- Features: Private, See Remarks, Low Maintenance
Details
- Parcel number: 061340017000
- Zoning: U
- Special conditions: Offer As Is
Construction
Type & style
- Home type: SingleFamily
- Architectural style: Ranch
Materials
- wood frame
- Roof: Metal
Condition
- Year built: 1978
Utilities & green energy
- Electric: Generator
- Sewer: Septic Connected
- Water: Private, Well
- Utilities for property: Electricity Connected
Community & HOA
Location
- Region: Berry Creek
Financial & listing details
- Price per square foot: $249/sqft
- Tax assessed value: $281,219
- Annual tax amount: $3,009
- Road surface type: Unpaved, Unimproved
Visit our professional directory to find a foreclosure specialist in your area that can help with your home search.
Find a foreclosure agentForeclosure details
Estimated market value
$319,000
$303,000 - $335,000
$1,933/mo
Price history
| Date | Event | Price |
|---|---|---|
| 12/1/2025 | Listing removed | $278,500-14%$217/sqft |
Source: | ||
| 6/23/2025 | Listed for sale | $324,000+13.7%$253/sqft |
Source: | ||
| 7/12/2022 | Listing removed | -- |
Source: MetroList Services of CA #221118670 Report a problem | ||
| 1/10/2022 | Pending sale | $285,000$222/sqft |
Source: | ||
| 9/16/2021 | Listed for sale | $285,000+105%$222/sqft |
Source: | ||
| 12/23/2014 | Sold | $139,000$108/sqft |
Source: MetroList Services of CA #201401545 Report a problem | ||
| 9/8/2014 | Pending sale | $139,000$108/sqft |
Source: Sunset Vista Realty, Lakeside #OR14100768_MRMLS Report a problem | ||
| 9/8/2014 | Listed for sale | $139,000$108/sqft |
Source: Sunset Vista Realty, Lakeside #OR14100768_MRMLS Report a problem | ||
| 7/28/2014 | Listing removed | $139,000$108/sqft |
Source: Sunset Vista Realty #OR14100768 Report a problem | ||
| 7/9/2014 | Price change | $139,000-6.7%$108/sqft |
Source: Sunset Vista Realty, Lakeside #OR14100768_MRMLS Report a problem | ||
| 5/16/2014 | Listed for sale | $149,000$116/sqft |
Source: Sunset Vista Realty, Lakeside #OR14100768_MRMLS Report a problem | ||
Public tax history
| Year | Property taxes | Tax assessment |
|---|---|---|
| 2025 | $3,009 +1.4% | $281,219 +2% |
| 2024 | $2,967 +1.4% | $275,706 +2% |
| 2023 | $2,927 +807.9% | $270,300 +854.8% |
| 2022 | $322 -60.8% | $28,310 +2% |
| 2021 | $822 -43% | $27,755 -79% |
| 2020 | $1,442 +1.8% | $131,866 +2% |
| 2019 | $1,417 +1.5% | $129,282 +2% |
| 2018 | $1,396 +2.7% | $126,748 +2% |
| 2017 | $1,360 +2.5% | $124,264 +2% |
| 2016 | $1,326 +17.3% | $121,829 +1.5% |
| 2015 | $1,130 | $120,000 +15.9% |
| 2014 | $1,130 | $103,509 +0.5% |
| 2013 | -- | $103,042 +2% |
| 2012 | -- | $101,023 +2% |
| 2011 | -- | $99,043 +0.8% |
| 2010 | -- | $98,304 -0.2% |
| 2009 | -- | $98,539 +2% |
| 2008 | -- | $96,608 +2% |
| 2007 | -- | $94,715 +2% |
| 2006 | -- | $92,859 +2% |
| 2005 | -- | $91,039 +2% |
| 2004 | -- | $89,254 +1.9% |
| 2003 | -- | $87,619 +2% |
| 2002 | -- | $85,902 +2% |
| 2001 | -- | $84,218 |
Find assessor info on the county website
Monthly payment
Estimated monthly payment$1,822
All calculations are estimates and provided by Zillow, Inc. for informational purposes only. Actual amounts may vary.
HOA fees may include property taxes on listings classified as Co-Ops. Contact the listing agent and/or owner for fee details.
Mortgage interest rates are dependent on a number of factors, including credit score, down payment, and repayment length. Interest rate data provided by Zillow Group Marketplace, Inc. as of 1/1/1970 from various mortgage lenders with which we have lead or other similar arrangements; the Estimated Payment is an average of those rates.
See how much you could borrow to make a competitive offer.
Climate risks
Neighborhood: 95916
Getting around
0 / 100
Car-DependentNearby schools
GreatSchools rating
- 5/10Berry Creek Elementary SchoolGrades: K-8Distance: 5.4 mi
- 4/10Las Plumas High SchoolGrades: 9-12Distance: 18.7 mi


- California
- Butte County
- Berry Creek
- 95916
- 52 Fox Hill Rd
Nearby cities
Nearby zip codes
Other Berry Creek Topics
